Figure 2.
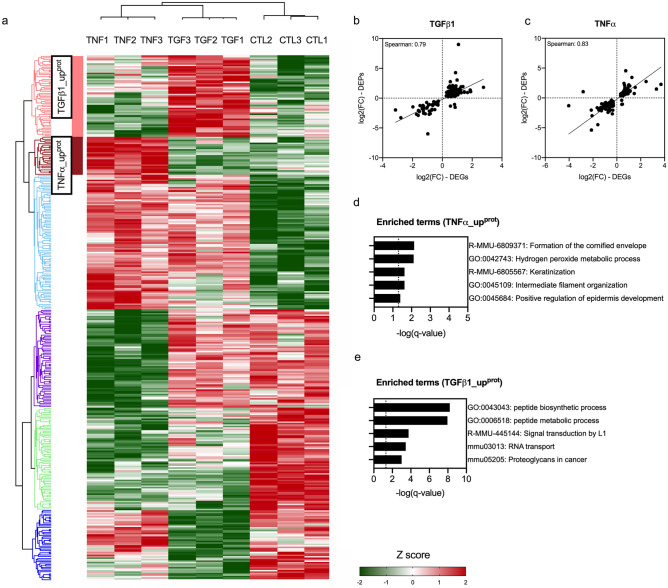
Proteome analysis of control, TGFß1- and TNFα-treated MEFs using LC–MS/MS. (a) Heatmap summarizing DEPs in TGFß1- (5 ng/ml) or TNFα- (10 ng/ml) treated MEFs for 72 h compared to untreated MEFs (controls; q-value < 0.05) after normalization with Z-score. Hierarchical clustering was constructed with Euclidean distance using Perseus software (https://maxquant.net/perseus). (b–c) Spearman correlation of DEGs expressed as log2(FC) assessed by RNA microarrays and DEPs as log2(FC) assessed by LC–MS/MS in TGFß1 (b; n = 150) and TNFα- treated (c; n = 110) MEFs compared to control MEFs. (d–e) Enrichment analysis summarizing the most representative up-regulated pathways in TGFß1_upprot and in TNFα_upprot (q-value < 0.05) using Metascape (http://metascape.org/gp/index.html#/main/step1). N = 3 biological replicas (3 independent experiments).

