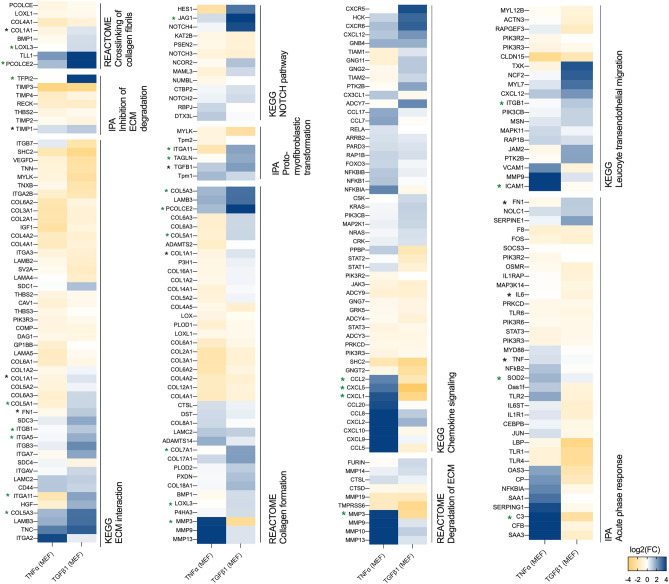
Figure 3.
Gene expression of pathways related to the inflammatory response and to ECM organization in TGFß1- and TNFα-treated MEFs. Gene expression of pathways in TGFß1- and TNFα-treated MEFs expressed as log2 (Fold change vs. controls) assessed by RNA microarrays. Gene lists come from molecular signatures database (MSigDB) (http://software.broadinstitute.org/gsea/msigdb/index.jsp) and Ingenuity Pathway Analysis (Qiagen, Inc) (https://digitalinsights.qiagen.com). Only significant genes are presented in heatmaps (q-value < 0.05) generated using Prism (https://www.graphpad.com/scientific-software/prism/). Candidate genes and classical genes are respectively marked with green or black mark.

