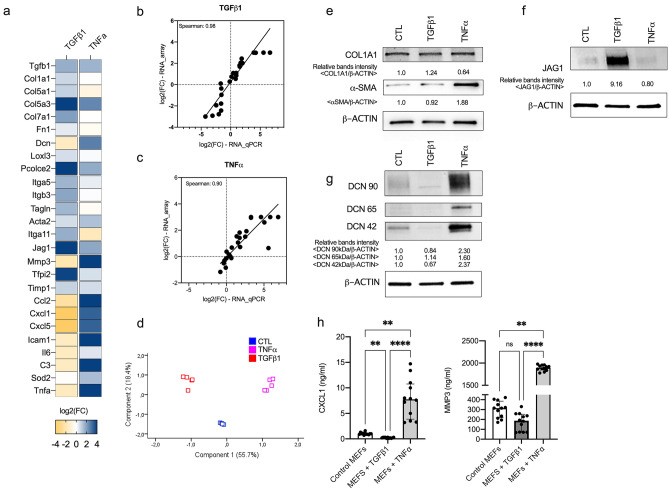
Figure 4.
Gene signature expression. (a) Genes of gene set differentially expressed in TNFα-treated, TGFß1-treated MEFs compared to control MEFs assessed by RT-qPCR. Fold changes are log2-transformed and expressed as a double gradient colormap. Log2 values of fold changes are censored at − 4 or 4 for better viewing. (b–c) Spearman correlations of genes expressed as log2(FC) assessed by RNA microarray (at 24 h) and by RT-qPCR (at 24 h) in TGFß1- (b) and TNFα-treated (c) MEFs compared to control MEFs. (d) Principal component analysis of MEFs (controls, treated by TGFß1 or TNFα) assessed by RT-qPCR. (e–g) Western Blot analysis of level of COL1A1 (e), αSMA (e), JAG1 (f), and DCN (g) in control, TGFß1- and TNFα-treated MEFs. Intensities of specific bands was measured by densitometry. ß-ACTIN was used for normalization of data. Experiment is representative of n = 3 independent experiments. Full unedited Western Blot are provided in supplementary Figs. S8–S10. (h) Quantification of CXCL1 (ng/ml) and MMP3 (ng/ml) in the supernatant sample (n = 12/group; 3 independent experiments). Numbers are expressed as median with IQR.

