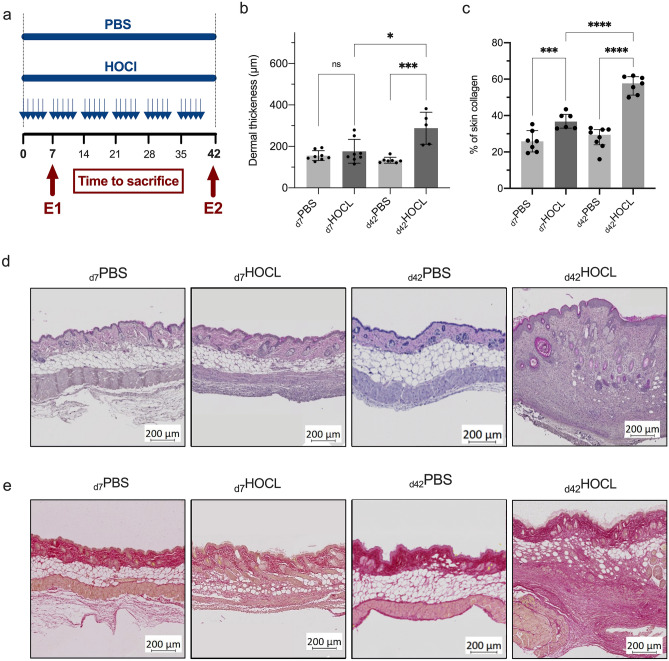
Figure 5.
Inflammation-mediated fibrosis model. (a) Experimental procedure and sample collection times. Two independent experiments: E1 at the inflammatory stage (early stage); E2 at the fibrotic stage (late stage); (b) Dermal thickness estimated by measuring the distance between the dermoepidermal junction and the junction between the dermis and subcutaneous fat at 20X magnification using ImageJ morphometric software. Twenty random measurements were performed per section. (c) Collagen deposition in the skin evaluated using Picrosirius red staining expressed as % of the area occupied by collagen. (d) Representative sections of skin samples from PBS mice and HOCl mice under light microscopy after HE staining. (e) Representative sections of skin samples from PBS mice and HOCl mice at each time point, observed by light microscopy after staining with Picrosirius red. Medians with IQR are shown.

