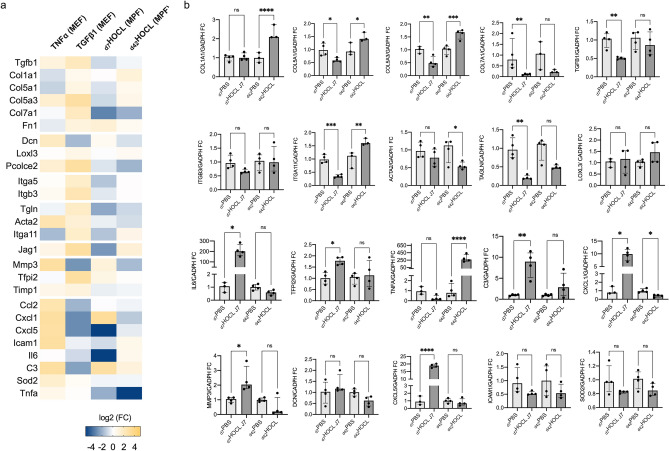
Figure 6.
Gene signature expression assessed by RT-qPCR in HOCL mice and in PBS mice at day 7 and day 42. (a) Heatmap showing the transcript gene set expression assessed by RT-qPCR from (i) TNFα-treated MEFs (compared to control MEFs), (ii) TGFß1-treated MEFs (compared to control MEFs), (iii) d7HOCL MPFs (compared to d7PBS MPFs), and (iv) d42HOCL MPFs (compared to d42PBS MPFs). Fold changes are log2-transformed and expressed as a double gradient colormap. Log2 values of fold changes are censored at -5 or 5 for better viewing. The heatmap was generated using Prism (https://www.graphpad.com/scientific-software/prism/), (b) RT-qPCR results. Numbers are expressed as median fold change (IQR) compared to PBS at day 7 or day 42. P-value: *** ≤ 0.001, ** ≤ 0.01, * ≤ 0.05. ns: > 0.05.

