Figure 2.
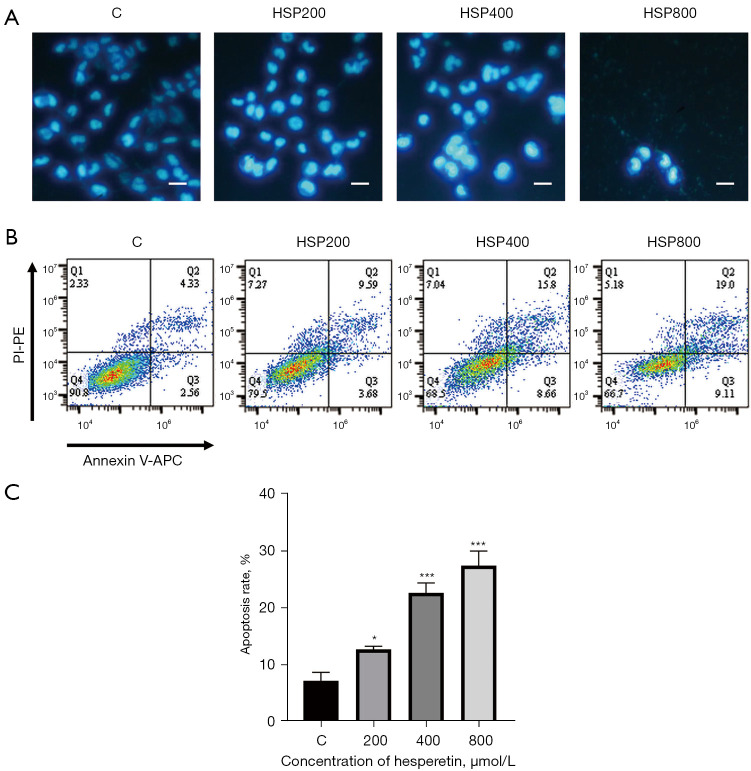
Hesperetin induced cell apoptosis. (A) GL261 cells were treated with hesperetin at indicated concentrations for 24 h. After incubation with Hoechst 33342, the cells were observed with fluorescence microscopy. (B) According to the instruction of the Annexin V-APC/PI apoptosis kit, the apoptosis rate was detected using a flow cytometer. (C) Histogram of the apoptosis rate in response to the hesperetin treatment. Scale bar represents 50 µm. Data are presented as the mean ± standard deviation (SD; *, P<0.05 and ***, P<0.001 vs. control). C represents control group (without HSP treatment). HSP, hesperetin; PI, propidine iodide.

