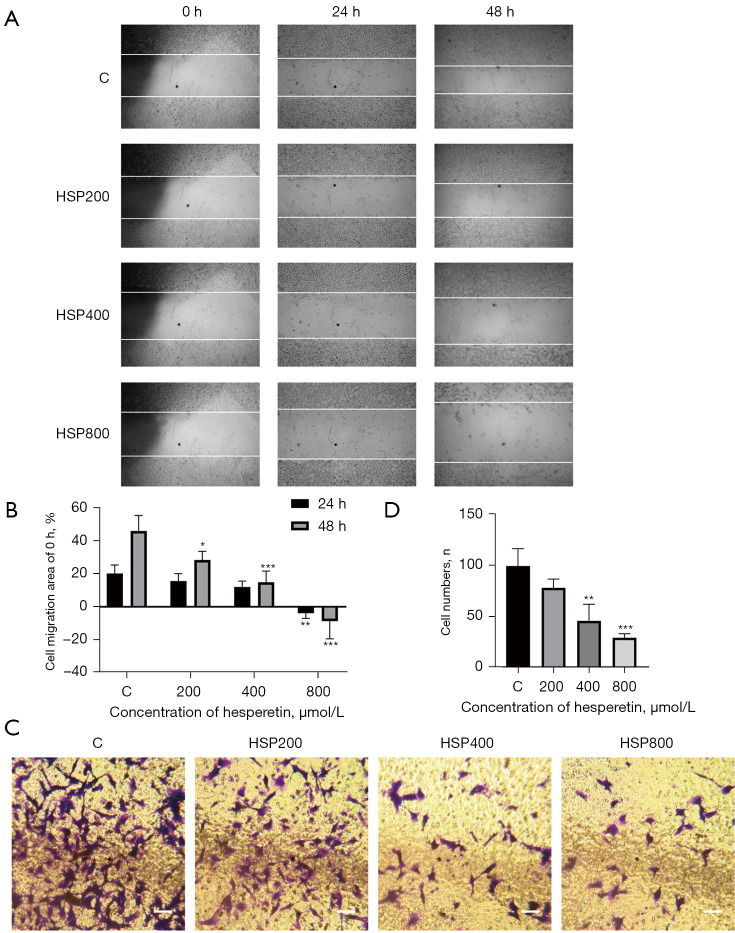
Figure 5.
Hesperetin inhibited cell migration and invasion. (A) Gl261 cells were treated with hesperetin at indicated concentrations. A wound-healing assay was performed to detect cell migration. The wound area was photographed with a phase contrast microscope and calculated at 0, 24, and 48 h (200×). (B) Histogram of the migration rate (%) in response to hesperetin treatment. Data are presented as the mean ± standard deviation (SD; *, P<0.05, **, P<0.01, and ***, P<0.001 vs. control). (C) Transwell assay was performed to detect cell invasion. The cells passing through the Matrigel-coated Transwell chamber were photographed after crystal violet staining under a microscope and calculated. Scale bar represents 100 µm. (D) Histogram of the cells passing through the Matrigel-coated Transwell chamber in response to the hesperetin treatment. Data are presented as the mean ± SD (**, P<0.01 and ***, P<0.001 vs. control). C represents control group (without HSP treatment). HSP, hesperetin.

