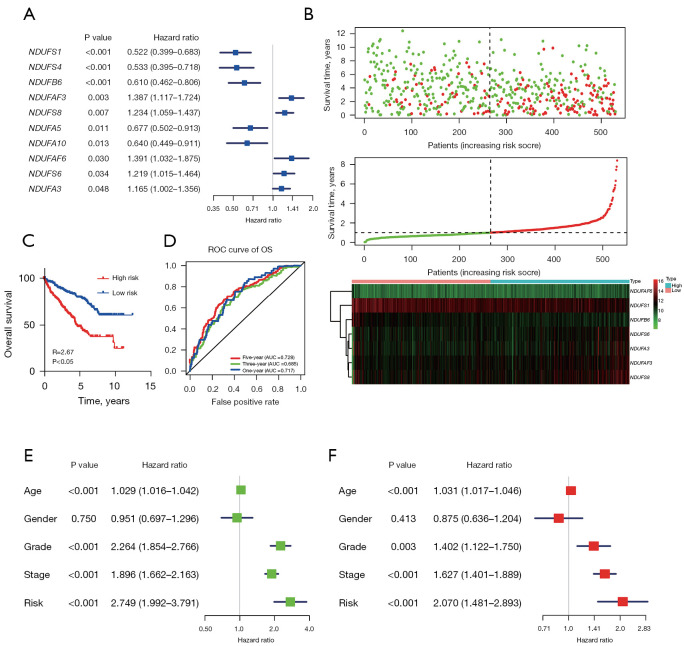
Figure 6.
A risk model based on CI expression can predict patient’s prognosis. (A) The result of univariate Cox regression analyses. (B) A combined plot showing the relationship among risk score, survival time, and expression of 7 genes. (C) Kaplan-Meier OS curves for patients with high/low risk score. (D) Time-dependent ROC analysis showing the 1-, 3- and 5-year AUC. (E) Univariate Cox regression analyses. (F) Multivariate Cox regression analyses. ROC, receiver operating characteristic; OS, overall survival; AUC, area under the curve; CI, complex I.

