Figure 5.

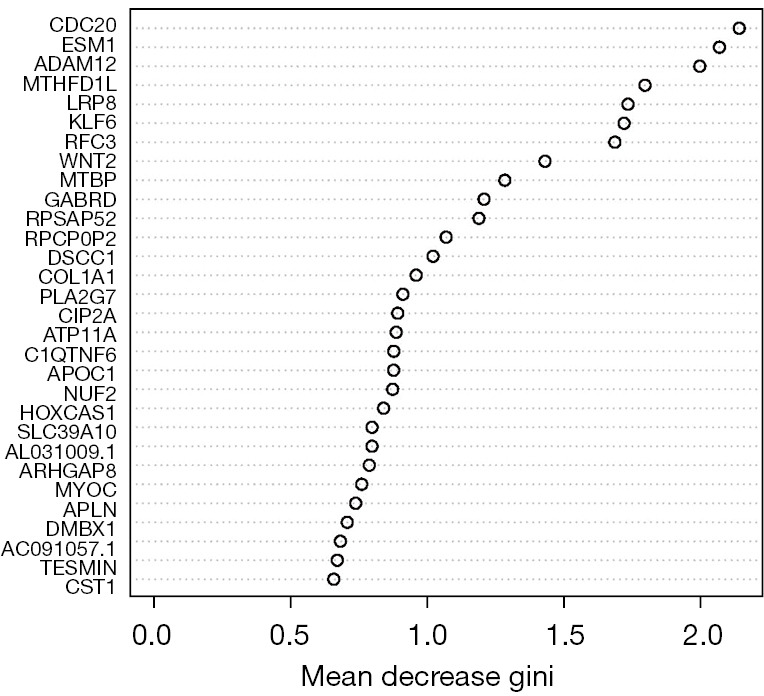
Characteristic gene Gini index. The horizontal axis represents mean decrease Gini, and the vertical axis represents characteristic genes.

Characteristic gene Gini index. The horizontal axis represents mean decrease Gini, and the vertical axis represents characteristic genes.