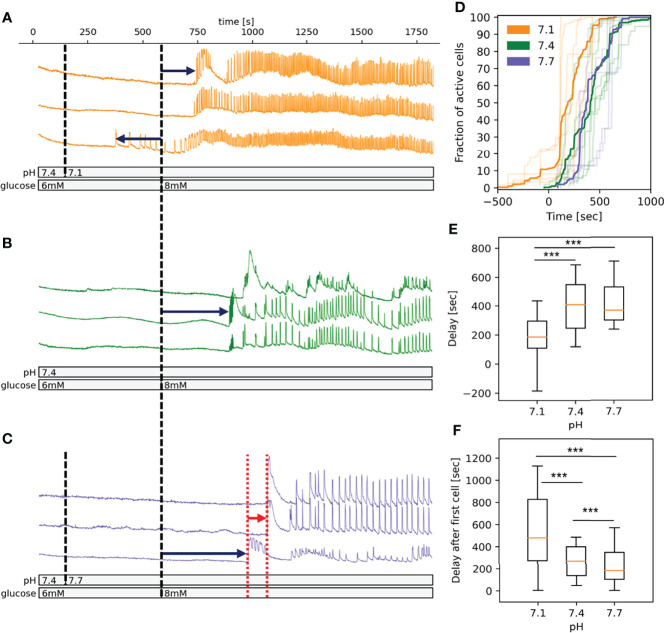
Figure 1.
pH-dependency of activation of beta cells in islets in fresh pancreatic slices. (A) Time course of the [Ca2+]c oscillations in a selection of beta cells exposed to pH 7.1 for 10 min followed by stimulatory glucose concentration (8 mM). Dark blue arrows indicate the delay time from introduction of stimulatory glucose to activation and red arrow indicates the time of delays from activation of first cell to the activation of every other cell. (B) As panel A at pH 7.4 (C) As panel A at pH 7.7. (D) Pooled data showing the fraction of active cells in time. The acidification induces a left shift of activation curve. Semi-transparent lines show results of the individual experiments, bold lines are the averages for each experimental condition. (E) Quantification of pooled data of delays from introduction of stimulatory glucose to activation. (F) Quantification of pooled data of delays from activation of first cell to the activation of every other cell. n=5 islets for each condition. Box plots are showing upper and lower quartile; line median; whiskers 5-95%. ***p < 0.001.

