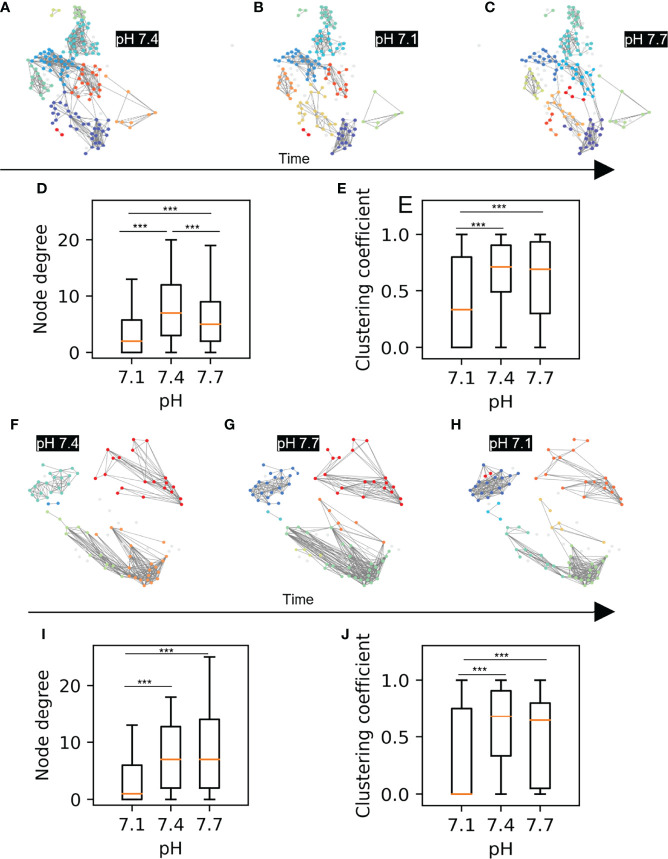
Figure 3.
Beta cell functional connectivity at different pH. (A) Functional networks of beta cells at 8 mM glucose and different pH changing in a sequence as indicated by the black arrow below: (A) 7.4, (B) 7.1, (C) 7.7. (D) Node degree of the pooled data for the sequence A-C. (E) Average clustering coefficient of the pooled data for the sequence A-C (F) Functional networks of beta cells at 8 mM glucose and different pH changing in a sequence as indicated by the black arrow: (F) 7.4, (G) 7.7, (H) 7.1 (I) Node degree of the pooled data for the sequence F-H. (J) Average clustering coefficient of the pooled data for the sequence F-H n=5 islets for each condition in the sequence A-C and n=3 for the sequence F-H. Box plots are showing upper and lower quartile; line median; whiskers 5-95%. (***p < 0.001).

