Fig. 3.
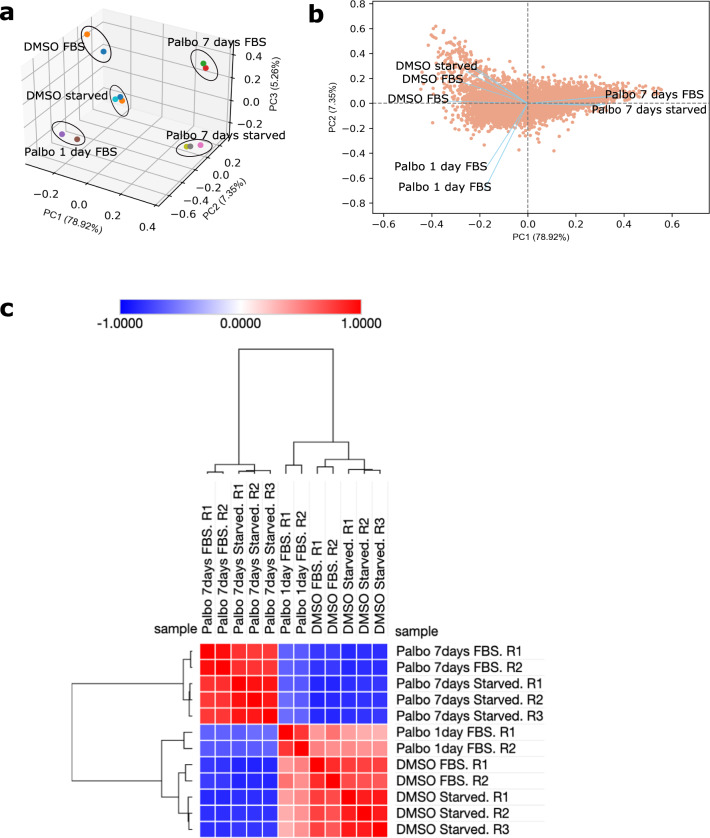
Reproducibility of proteomic samples. (a) Principal component analysis (PCA) was performed to illustrate the reproducibility of samples. The PCA plot shows clustering of samples with the same cell culture conditions.The first 3 principal components (PCs) contribute to 91.53% of the variation in the data. (b) A PCA biplot illustrating the PC loadings and the first two principal components, PC1 and PC2. The angle between vectors shows that Palbo 7 days FBS and Palbo 7 days starved samples are closely correlated. DMSO starved and DMSO FBS samples are correlated to eachother and have a low correlation with all Palbocicib-treated samples. The PCA analysis was carried out using the bioinfokit package in Python version 3.8.855. (c) A similarity matrix (Pearson correlation) of total protein scaled abundances which has been subjected to hierarchical clustering (Euclidean distance with complete linkage), to reveal that samples of the same conditions cluster together on the matrix. Thus, the samples of the same condition in question are highly correlated. The Phantasus server was used for this analysis (https://artyomovlab.wustl.edu/phantasus/).

