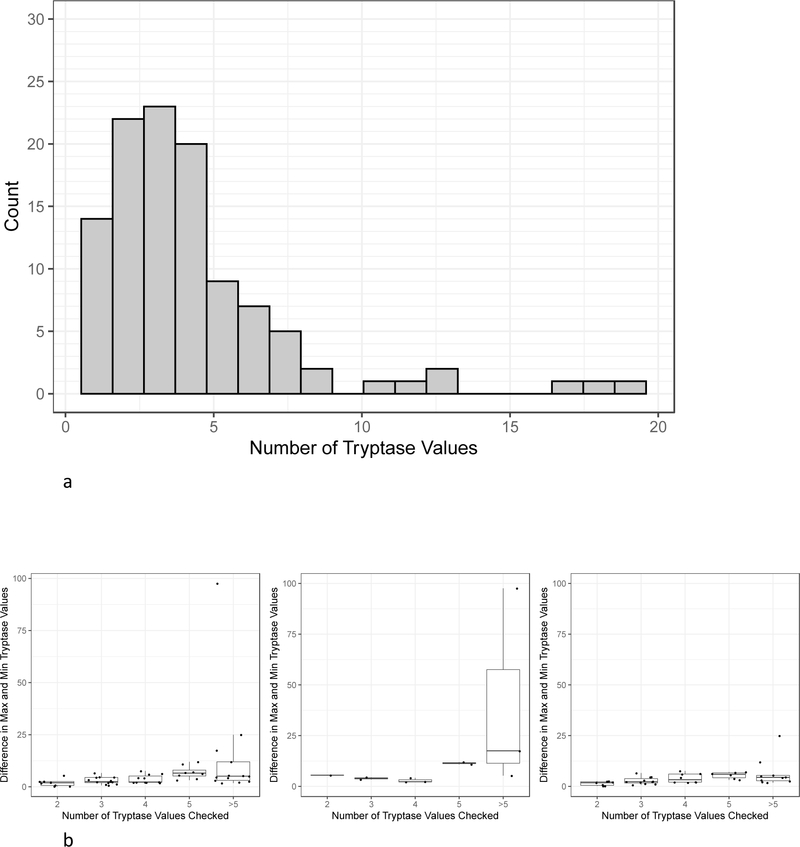
Figure 3.
A, Frequency histogram showing subjects with different counts of tryptase values checked. All 109 subjects were included. B, BST range (minimum subtracted from maximum) distribution by total number of tryptase values checked. Boxplots are shown. Left panel: 53 subjects with at least one elevated BST value and at least 2 tryptase values checked. Middle panel: 11/53 subjects with confirmed myeloid neoplasms (middle panel). Right panel: 42/53 subjects with CKD, HαT, non-myeloid HES, and no associated diagnosis.

