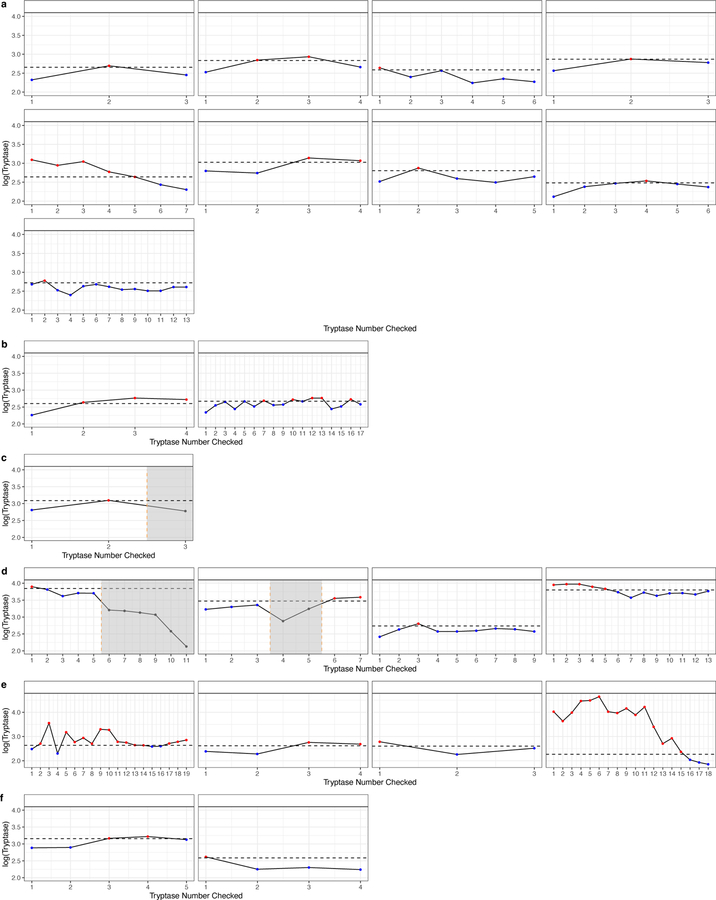
Figure 5.
Subjects with variability that exceeded 20+2 had basal tryptase values graphed ordinally. Horizontal dashed lines represent the threshold of the formula using the lowest tryptase value. Shaded regions corresponded to concurrent use of imatinib, prednisone, or hydroxyurea. (a) HαT (b) no associated diagnosis (c) SM-PV (d) mastocytosis (e) multiple diagnoses (f) CKD.

