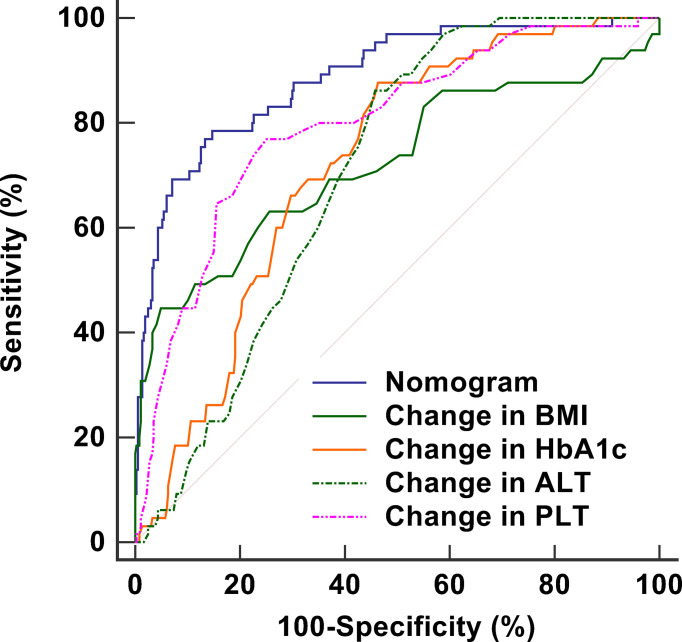
Figure 4.
ROC curves including nomogram and its components to assess the predictive accuracy of fibrosis progression. The AUC of the nomogram is 0.887, which is higher than the AUC values for changes in BMI (0.723), HbA1c (0.721), ALT (0.703), and PLT (0.797), demonstrating satisfied discrimination. ROC, receiver operating characteristic; AUC, area under the curve; BMI, body mass index; HbA1c, glycosylated hemoglobin A1c; ALT, alanine aminotransferase ratio; PLT, platelet counts.

