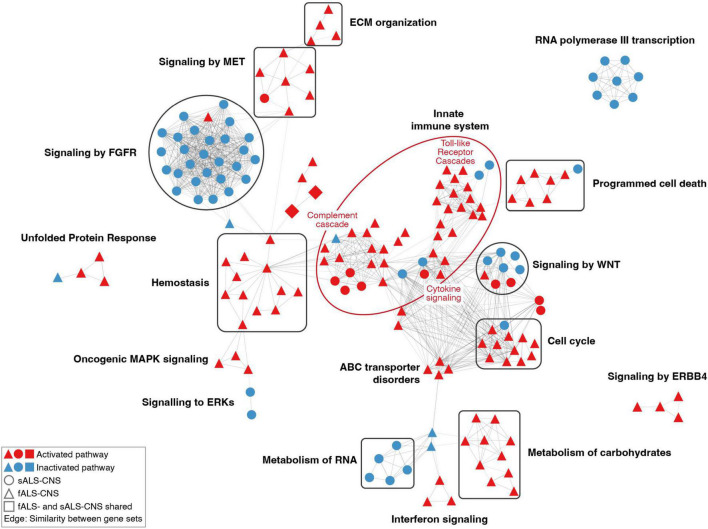
FIGURE 3.
Network of dysregulated pathways in CNS comparisons. Each node represented a dysregulated pathway consisting of a set of genes. Nodes with similar gene contents (similarity coefficient > 0.35) were connected by edges, and the thickness of node-linking edges was proportional to the similarity between a pair of gene sets. Clusters of pathways were annotated based on the hierarchical level of pathways retrieved from the Reactome database. The constituent pathways of a cluster were colored in red or blue for activation or inactivation. Only clusters containing more than three pathways were shown.

