
Figure 1.
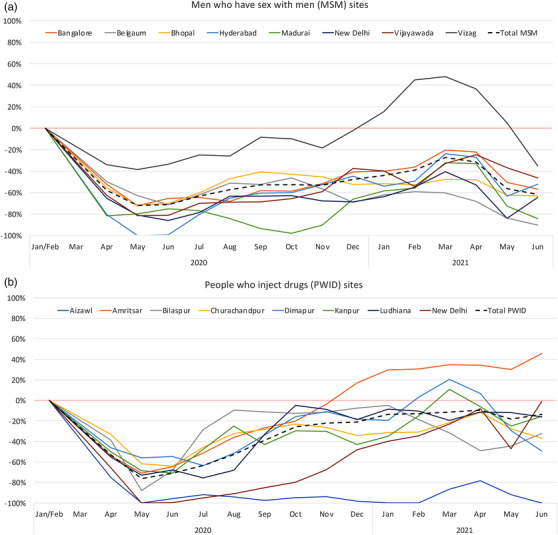
Percentage difference in integrated care centre service utilization (for any reason) among unique clients relative to the pre‐COVID‐19 pandemic period (January–February 2020) using a 2‐month moving average, by site/city, among men who have sex with men (Panel a) and people who inject drugs (Panel b).