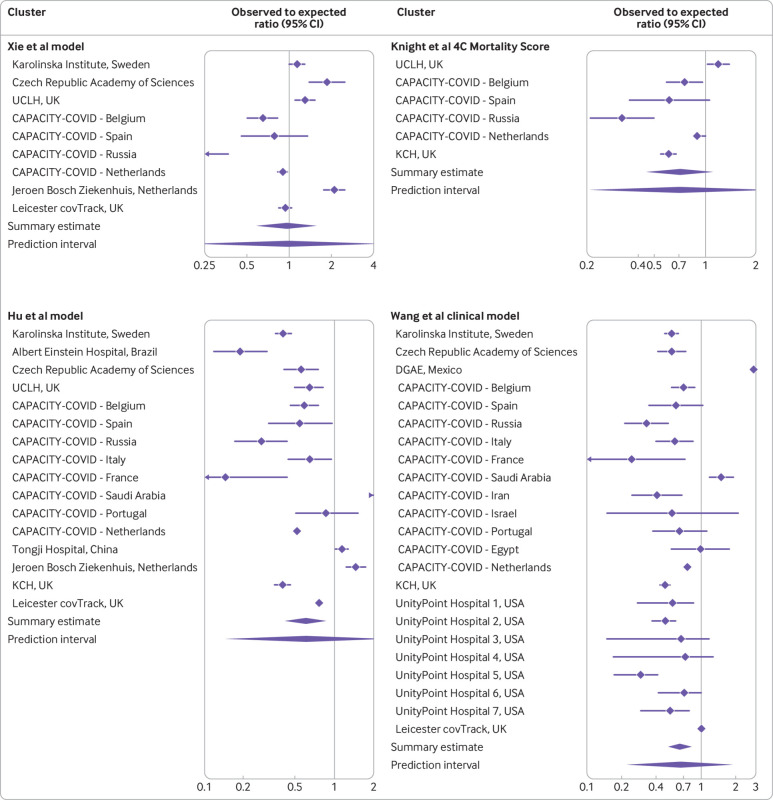
Fig 4.
Pooled observed to expected ratio estimates with corresponding 95% confidence interval and approximate 95% prediction interval for four models. Estimates are presented on the log scale. See supplementary file for full data. UCLH=University College London; DGAE=General Directorate of Epidemiology; KCH=King’s College Hospital

