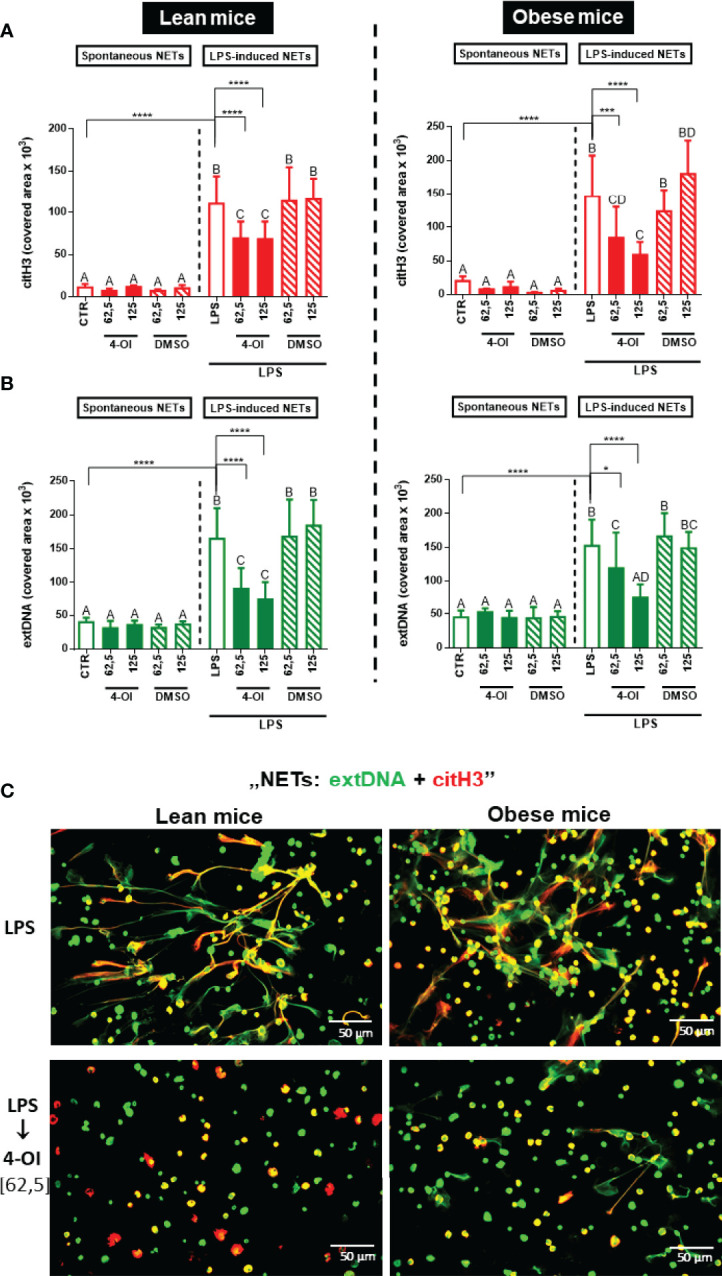
Figure 3.

Quantification of neutrophil extracellular trap (NET) formation by neutrophils of lean and obese mice upon 4-octyl itaconate (4-OI) treatment. Neutrophils isolated from the bone marrow of lean (control diet) and obese (high fat diet) mice were treated with 4-OI at concentrations of 62,5 µM and 125 µM for 1 hour. The remaining control groups of cells were treated with dimethylsulfoxide (DMSO) solvent in the same volume as it was used in 4-OI working solution (62,5 µM; 125 µM) or they were left unstimulated (CTR). Some of the cells were subsequently stimulated for 6 hours with lipopolysaccharide (LPS) at a concentration of 75 μg/ml. Quantification of NET formation: (A) area covered by the citrullinated histone H3 (citH3) signal and (B) area covered by extracellular DNA (extDNA) signal (left panel – lean mice, right panel – obese mice). (C) Representative images of neutrophils isolated from lean (left panel) and obese mice (right panel): NETs were visualized by co-staining of citrullinated histone H3 (citH3, red) and extDNA (green). The results are expressed as the mean values ± SD; n≥3. Values significantly different between the groups (p < 0.05) according to one-way ANOVA (post hoc Bonferroni test) are designated by letters, where the same letter indicates no differences between groups (different letters indicate statistical differences). Additionally asterisks indicate significant differences between groups according to unpaired two-tailed Student’s t-test (*p ≤ 0.05, ***p ≤ 0.001, ****p ≤ 0.0001).
