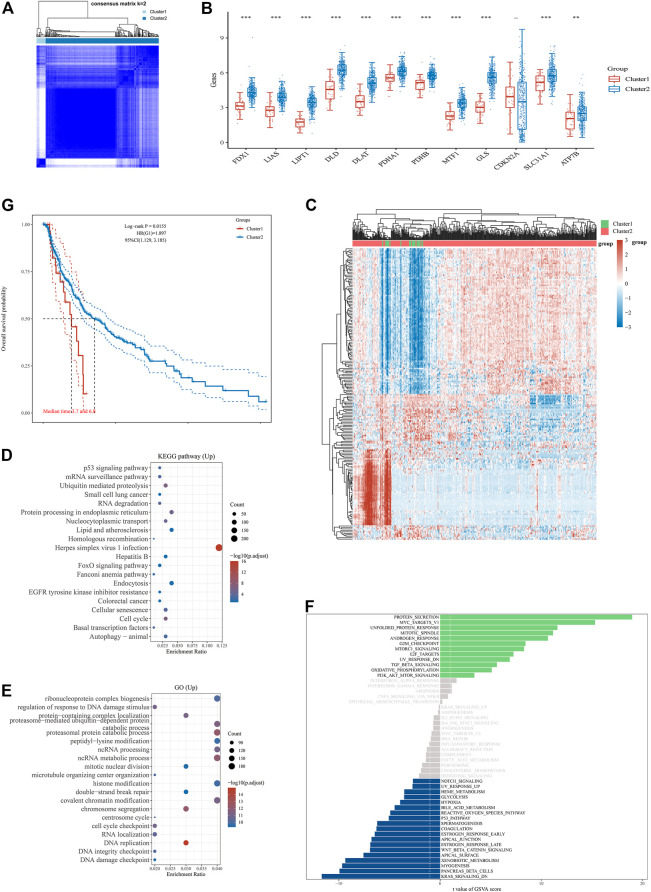
FIGURE 2.
Differential expression pattern of cuproptosis-related genes and survival and functional enrichment analysis in two Skin Cutaneous Melanoma (SKCM) clusters. (A) Consensus clustering matrix for k = 2. (B) Box plots visualized the expression patterns of cuproptosis-related genes in two SKCM clusters. (C) The heatmap of the differential gene expression between two SKCM clusters. (D–F) The most significant KEGG pathways (D), GO enrichment (E) and activation of multiple pathways by GSVA (F) in two SKCM clusters. (G) The Kaplan–Meier curves show the overall survival for two clusters of SKCM patients. **p < 0.01, and ***p < 0.001.

