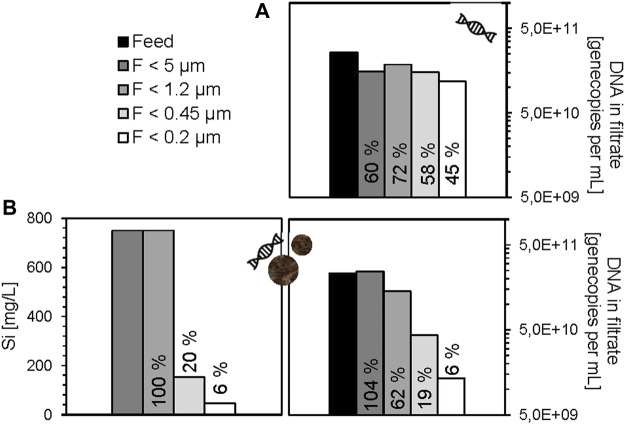
FIGURE 2.
Free DNA (eARG-fragment sul2 and eDNA fragment intl1) in filtrates of cascade filtration experiments without silica particles (A) and with silica particles (B) in ultrapure water. The percentage permeation of each step was calculated from the concentration of gene copies per mL filtrate divided by gene copies per mL feed (Cfil/Cfeed *100). Si concentration is shown for the filtrates of the experiment with DNA and silica particles; in absence of silica particles, the Si concentration was at a blank level <0.3 mg L−1.

