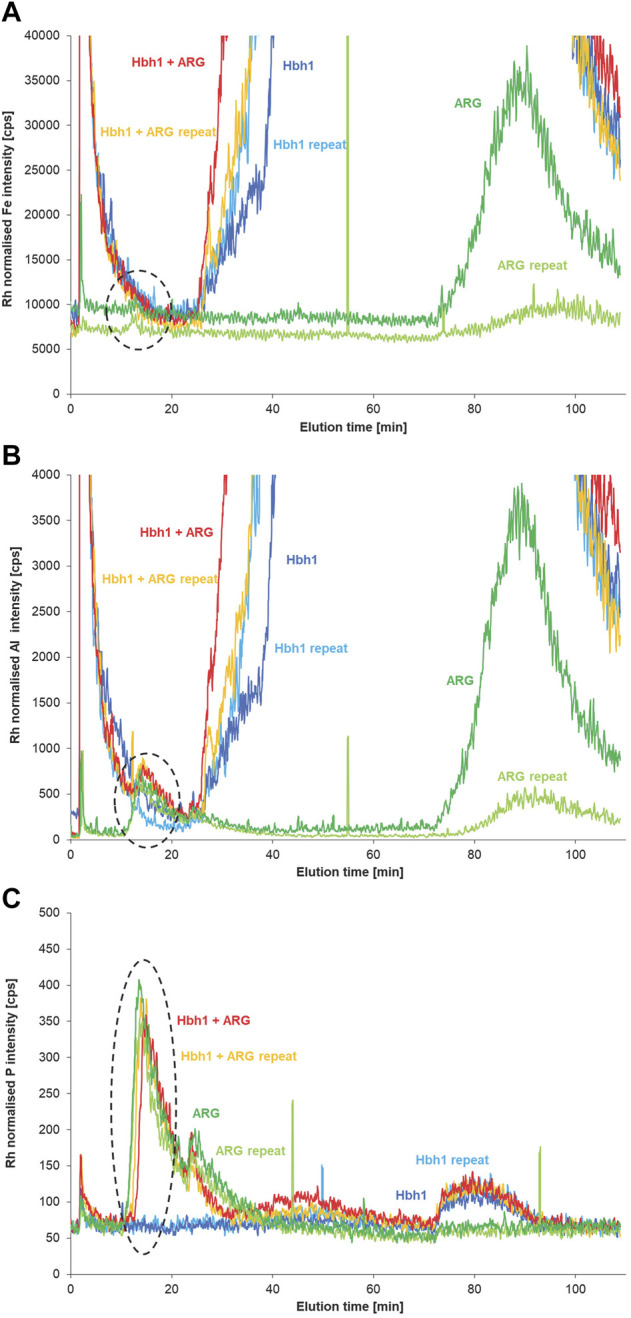
FIGURE 7.

AF4 fractograms of the natural water sample (Hbh1), the sample spiked with eARG fragment of 530 kDa, and the fragment in deionized water monitoring Fe (A), Al (B), and P (C) by ICP-MS (n = 2).

AF4 fractograms of the natural water sample (Hbh1), the sample spiked with eARG fragment of 530 kDa, and the fragment in deionized water monitoring Fe (A), Al (B), and P (C) by ICP-MS (n = 2).