FIGURE 3.
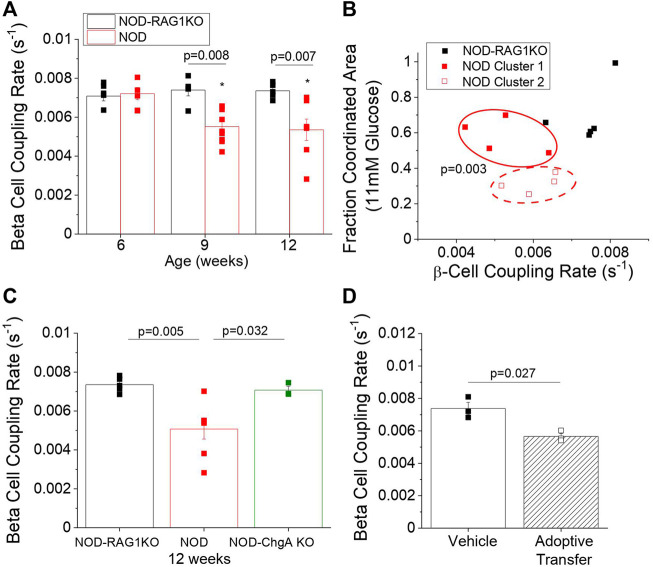
NOD mice have decreased β-cell coupling as early as 9 weeks of age and decreased β-cell coupling in the NOD mouse is mediated by autoreactive T-cells. (A) β-cell coupling as measured by fluorescence recovery rate in isolated islets from 6, 9, and 12-week old NOD (red, n = 6–9) and NOD-RAG1KO (black, n = 5–6) mice. Data represent the mean ± SEM. Data from individual mice are represented by black and red squares for NOD-RAG1KO and NOD mice respectively (n = 3–6). p < 0.05 is significant as determined by ANOVA. (B) K-means clustering analysis of the correlation between β-cell coupling and the fraction of the islet area with coordinated intracellular Ca2+ oscillations at 11 mM glucose in NOD and NOD-RAG1KO mice at 9 weeks of age. Red solid and dashed ovals indicate the clusters of animals identified by k-means analysis. (C) β-cell coupling as measured by fluorescence intensity recovery rate in isolated islets from 12-week old NOD (red), NOD-RAG1KO (black), and NOD chromogranin-A knockout (NOD-ChgA KO, green). Data from individual mice are represented by black, red, or green squares for NOD-RAG1KO, NOD, or NOD-ChgA KO mice respectively (n = 4–5). (D) β-cell coupling as measured by fluorescence intensity recovery rate in isolated islets from mice 2 weeks post-adoptive transfer with diabetogenic splenocytes or vehicle control. Data from individual mice are represented by solid or open squares for vehicle or adoptive transfer mice respectively (n = 3). Data in A and B represent the mean ± SEM. p < 0.05 is significant as determined by ANOVA in A and t-test in B. All animals are female unless otherwise noted.

