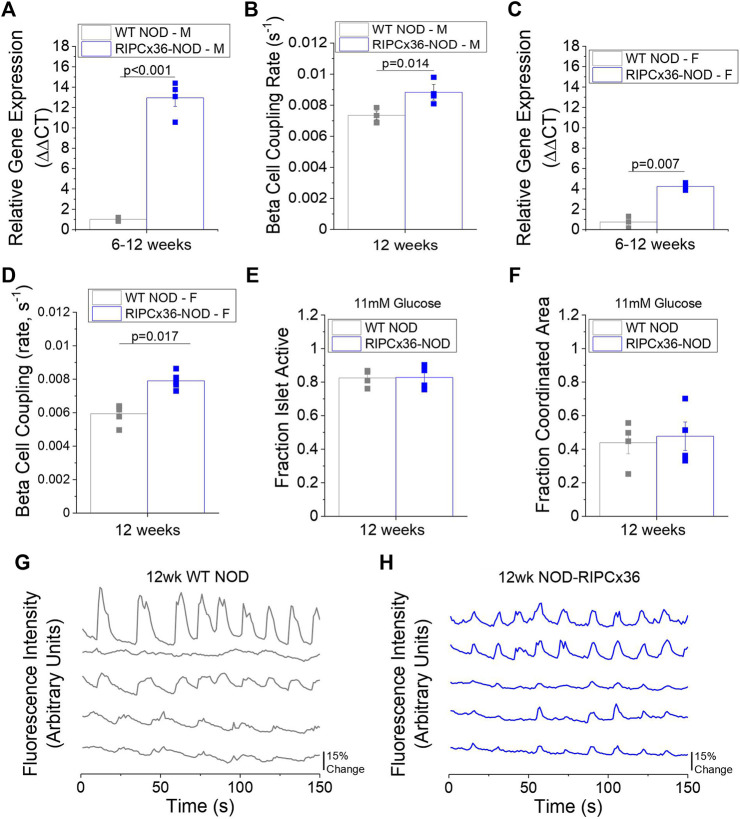
FIGURE 5.
Overexpression of Cx36 in the NOD mouse. (A) Gene expression of Cx36 in 8–12-week old male WT NOD and RIPCx36-NOD mice normalized to HPRT1 housekeeping gene using the ΔΔCt method (n = 4). (B) β-cell coupling as measured by fluorescence recovery rate in isolated islets from 12-week old male WT NOD (grey) and RIPCx36-NOD (blue) mice (n = 4). (C) Gene expression of Cx36 in 12-week old female WT NOD and RIPCx36-NOD mice normalized to HPRT1 housekeeping gene using the ΔΔCt method (n = 3). (D) β-cell coupling as measured by fluorescence intensity recovery rate in isolated islets from WT NOD and RIPCx36-NOD mice (n = 4–5). Quantification of the fraction of the islet area showing intracellular Ca2+ activity (E) and the fraction of the islet area with coordinated Ca2+ oscillations (F) at 11 mM glucose in isolated islets from 12 week old WT NOD and RIPCx36-NOD mice (n = 3–4). Representative plots of intracellular Ca2+ as measured by fluorescence intensity at 11 mM glucose in 5 individual cells in the same islet over time in 12-week old (G) WT NOD (grey) and (H) RIPCx36-NOD (blue) mice. Data from individual mice are represented by grey or blue squares for WT NOD or RIPCx36-NOD mice respectively. Data in A-F represent the mean ± SEM. p < 0.05 is significant as determined by t-test in A-F. All animals are female unless otherwise noted.

