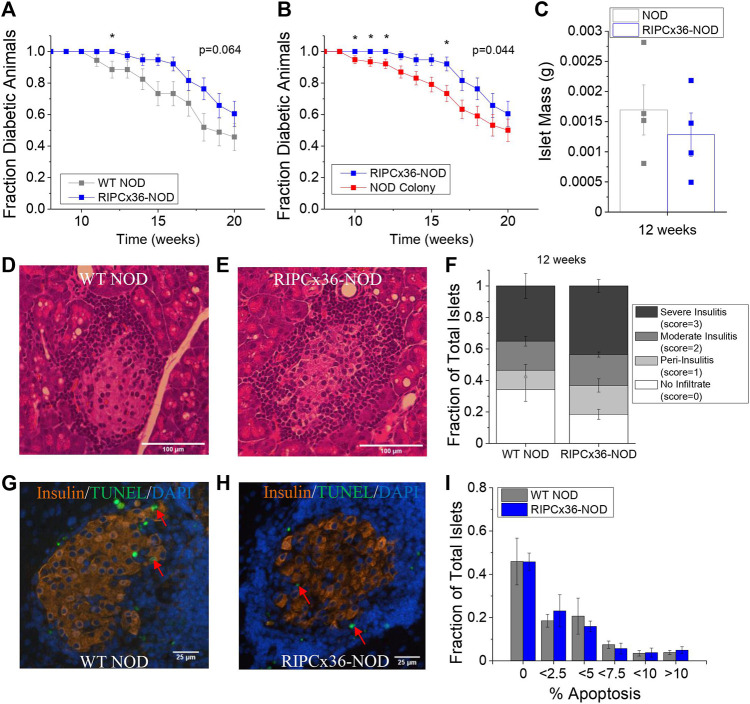
FIGURE 6.
Overexpression of Cx36 protects against T1D onset between 10–16 weeks of age in the NOD mouse. (A) Kaplan-Meier survival analysis of diabetes onset in WT NOD (grey, n = 34) and RIPCx36-NOD (blue, n = 38) mice. p < 0.05 indicates a significant difference in survival probability as determined by the Breslow test. (B) Kaplan-Meier survival analysis of diabetes onset in NOD mice (NOD colony, red, n = 77) and RIPCx36-NOD (blue, n = 38) mice. p < 0.05 indicates a significant difference in survival probability as determined by the Breslow test. (C) Average islet mass per pancreas in 12-week old WT NOD (grey) and RIPCx36-NOD (blue) pancreata. Representative images of H&E staining in WT NOD (D) insulitis score = 2 and RIPCx36-NOD (E) insulitis score = 3 pancreas. (F) Fraction of total islets averaged over 6 slices per pancreas with an insulitis score of 0, 1, 2, or 3 in 12-week old WT NOD (n = 5) and RIPCx36-NOD (n = 6) mice as determined by IHC. Representative images of TUNEL and insulin staining in pancreas sections from WT NOD (G) and RIPCx36-NOD (H) mice. Red arrows indicate TUNEL+ insulin + cells. (I) Histogram of the average fraction of total islets with increasing percentage of apoptotic (TUNEL+) insulin+ cells per islet in WT NOD (grey, n = 4) and RIPCx36-NOD (blue, n = 4) islets. Data represents the mean ± SEM. All animals are female unless otherwise noted.

