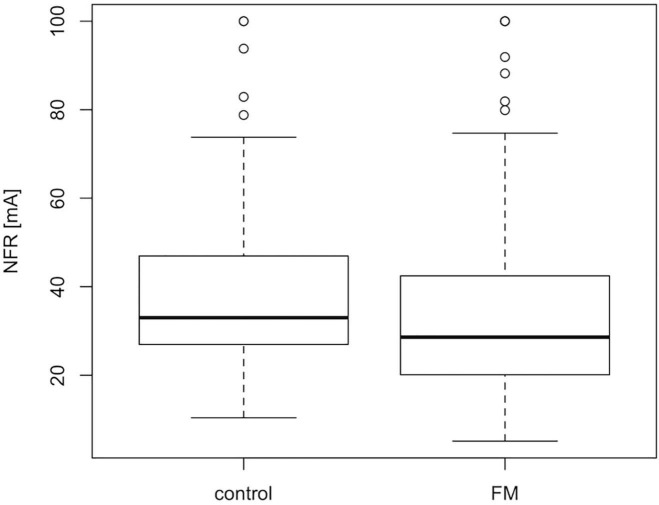
FIGURE 1.
Median NFR threshold is slightly lower in FMS patients than controls. Boxplot showing the median and IQR NFR thresholds values for FMS patients and controls included in the final GWAS population. The difference between the two populations is small but statistically significant according to the Mann–Whitney–Wilcoxon test, p-value <0.01; W = 6072.

