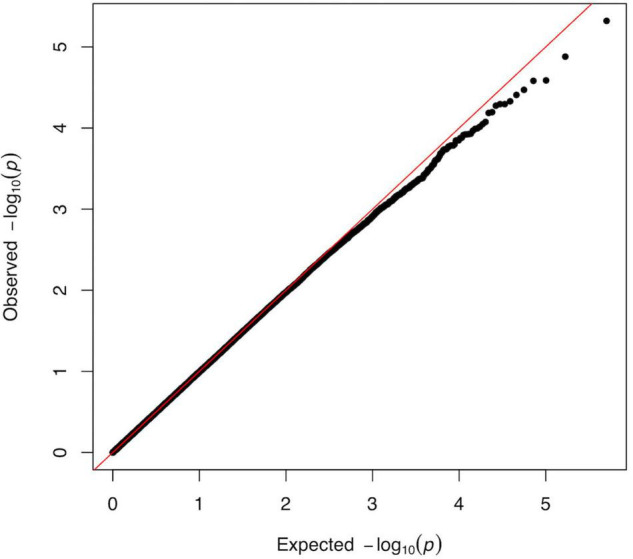
FIGURE 3.

QQ-plot from the linear regression analysis of the GWAS versus log10(NFR thresholds). Plot of observed versus expected distribution of p-values across all SNPs of the GWAS analysis. The predicted p-value is determined as a normally distributed set of probability statistics based on the number of SNPs included in the study (Turner, 2014). The graph shows no major deviation from normality (diagonal) and suggest the absence of confounder in the data. The tendency observed for the lowest p-values indicating that we identified less highly specific targets than might have been expected from a completely random distribution, could reflect the high complexity of the trait as well as the genetic redundancy underlying fundamental neuronal processes. The genetic inflation statistics (λGC = 0.989, λ1000 = 0.962) reveals no systematic population stratification bias in our analysis.
