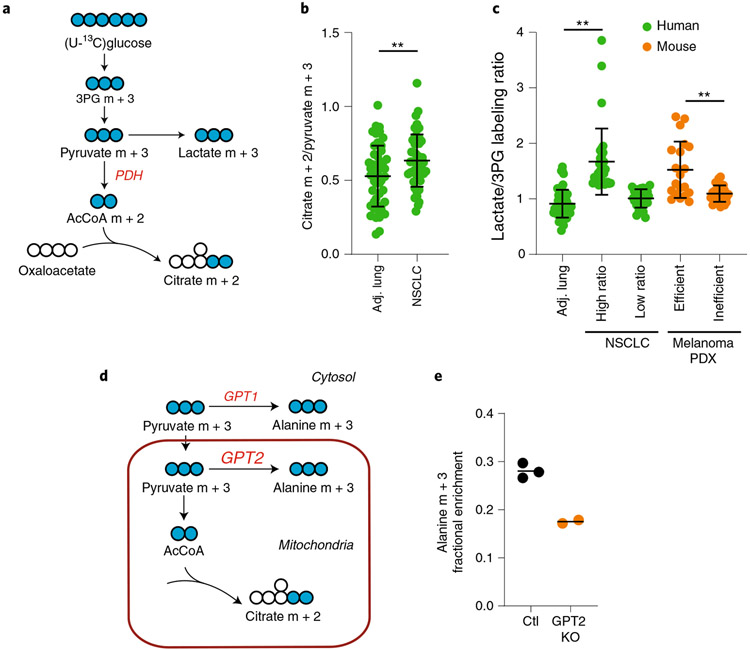
Fig. 6 ∣. Examining metabolic features among tumor and tissue types.
a, Schematic of labeling downstream of [U-13C]glucose. b, Citrate m + 2/pyruvate m + 3 ratios in healthy lung and tumors. **P < 0.01 (Welch’s t-test). c, Lactate/3PG labeling ratios in patients and xenograft-bearing mice. Human data: **P < 0.001, Kruskal–Wallis test, Dunn’s post-hoc. PDX data: **P < 0.01 Mann–Whitney test. d, Schematic of alanine labeling from 13C-pyruvate via either of two isoforms of GPT (GPT1 or GPT2). e, Alanine labeling after infusion of [U-13C]glucose into mice with control (Ctl) xenografts or xenografts lacking GPT2 (GPT2 KO). 3PG, 3-phosphoglycerate; PDH, pyruvate dehydrogenase; PC, pyruvate carboxylase; GPT, glutamate pyruvate transaminase; NSCLC, non-small cell lung cancer; PDX, patient-derived xenograft. Data are expressed as average and standard deviation.

