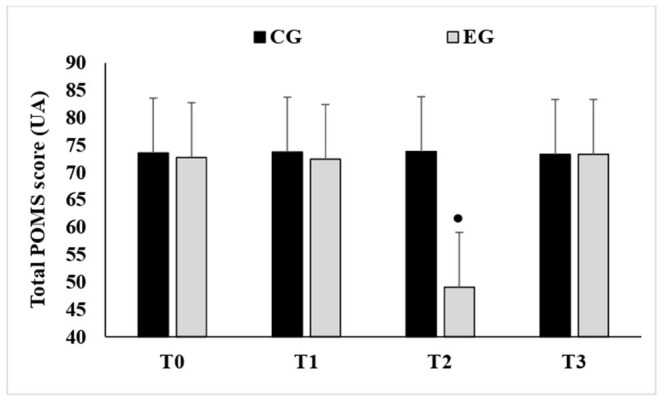
Figure 2.

Mean values ± standard deviation (SD) of total scores registered by the Profile of Mood State questionnaire recorded before the start of Ramadan (T0), on the 15th day of Ramadan (T1), at the end of Ramadan (T2) and after Ramadan (T3) in the experimental group (EG, n = 12) and the control group (CG, n = 12). •, Significant difference compared to T2.
