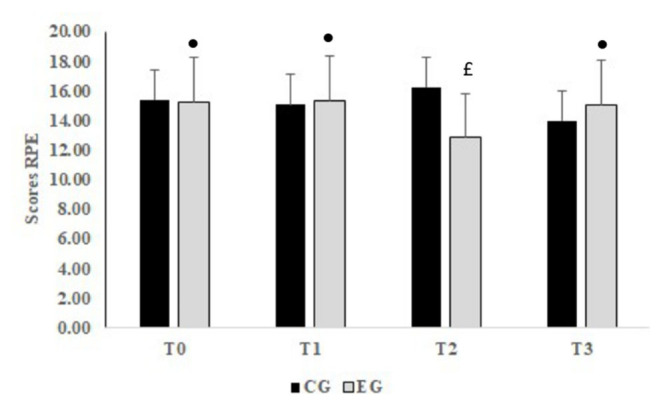
Figure 4.

Mean values ± standard deviation (SD) for RPE (rating of perceived exertion) registered before Ramadan (T0), in the second week of Ramadan (T1), in the fourth week of Ramadan (T2) and after Ramadan (T3) in CG (n = 12) and EG (n = 12). •, Significant difference compared to T2; £, Significant difference compared to CG.
