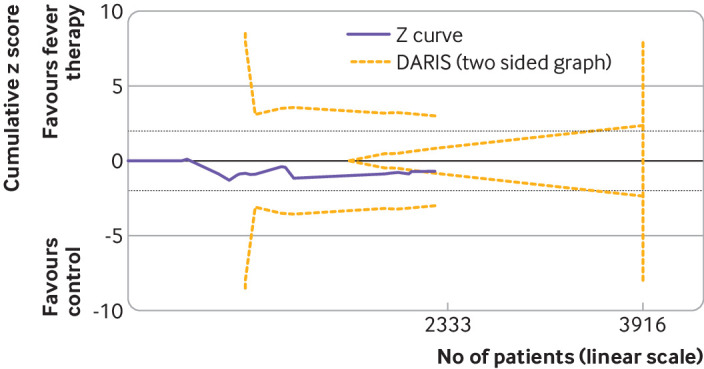
Fig 5.

Trial sequential analysis of fever therapy versus control interventions for serious adverse events. Two sided trial sequential analysis graph of fever control interventions versus control interventions for serious adverse events in 16 trials. Diversity adjusted required information size (DARIS) was calculated on basis of all cause mortality proportion in control group of 22.6%, relative risk reduction of 23% in experimental group, type I error (α) of 2%, and type II error (β) of 10% (90% power). Diversity was 21%. Required information size was calculated to be 3916 participants. Cumulative Z curve (purple line) did not cross trial sequential monitoring boundaries for either benefit or harm. Cumulative Z curve did cross inner wedge futility line (yellow outward sloping lines). Black dashed lines show conventional boundary (α=5%).
