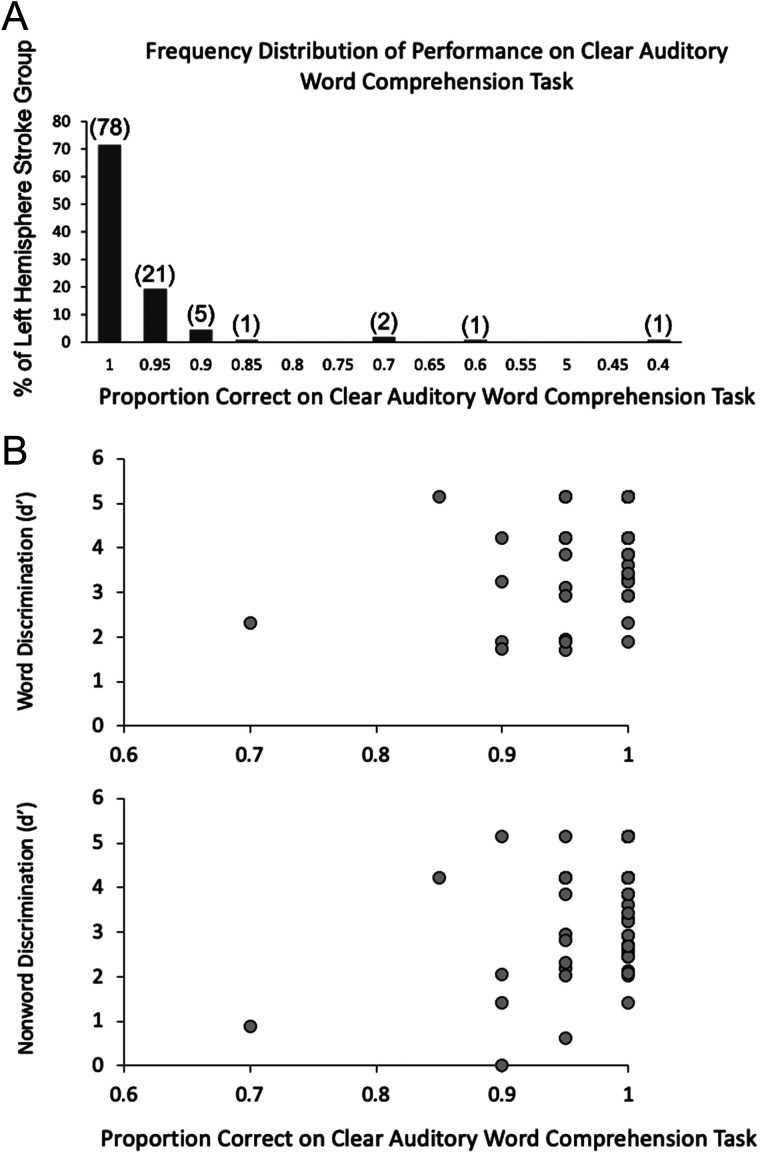
Figure 4. .
(A) Distribution of performance of the left hemisphere stroke group on the clear auditory comprehension task. Numbers in parentheses indicate the actual number of left hemisphere stroke participants who performed at that accuracy level (out of a total 109 who completed the task). Note that chance performance would be .25 proportion correct (not shown). (B) Distribution of performance of the left hemisphere stroke group on the clear auditory comprehension task as a function of word discrimination (top) and nonword discrimination (bottom) task performance.

