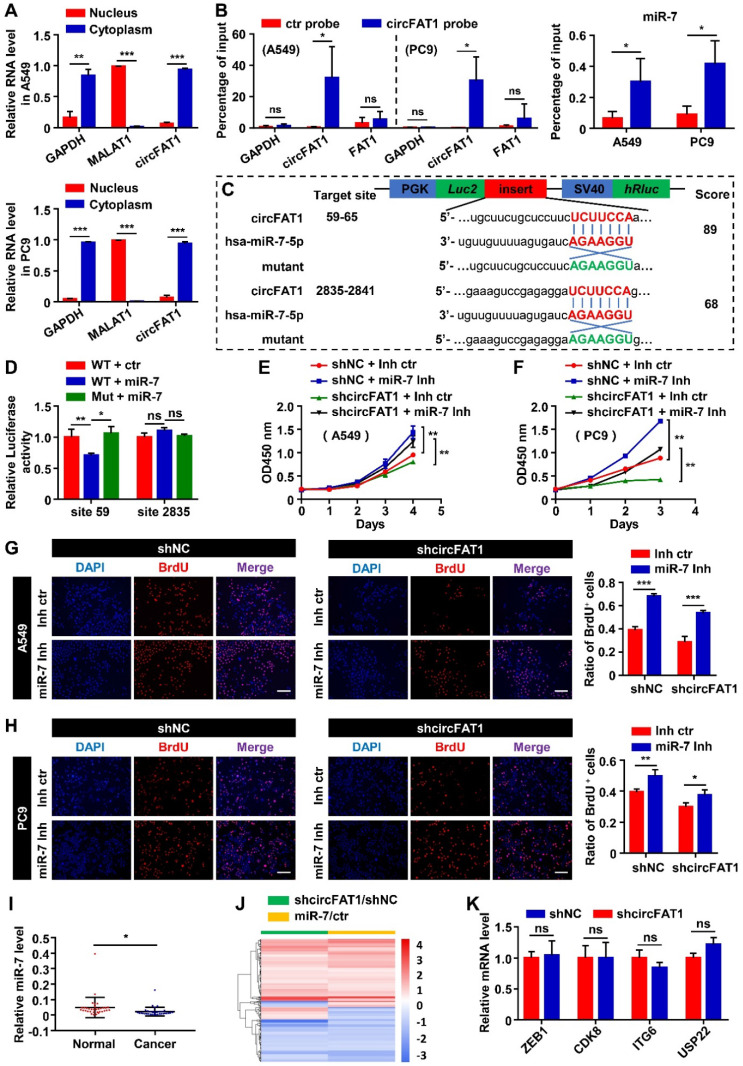
Figure 3.
CircFAT1 functions as a sponge for miR-7. (A) RT-qPCR analysis of nuclear and cytoplasmic fractionations to detect the subcellular localization of circFAT1 in A549 (Upper) and PC9 cells (Lower). GAPDH and MALAT1 were used as cytoplasmic and nucleic RNA control, respectively. (B) circFAT1 and miR-7 were co-pulled-down by a circFAT1-specific probe from fixed A549 and PC9 cells. (Left) The circFAT1-specific probe drastically enriched circFAT1 but not GAPDH and FAT1 mRNA as detected by RT-qPCR. The control probe pulled-down background levels of the RNAs. (Right) MiR-7 was also enriched in the pull-down products by the circFAT1-specific probe over that of the control. (C) Schematic illustration of the luciferase reporter, the cloned circFAT1-WT and circFAT1-Mut miR-7-binding sequences, and hsa-miR-7-5p sequence. The scores of miR-7-binding sites predicted by CircInteractome were listed on the right side. (D) The relative luciferase activities in 293T cells after co-treatment of circFAT1-WT or circFAT1-Mut with miR-7 mimic or miRNA mimic control to show site 59 was capable of downregulating luciferase activity in the presence of miR-7 mimic. (E-H) Cell proliferation rescue assay showing that miR-7 inhibitor rescue shcircFAT1 phenotype analyzed in A549 and PC9 cells by CCK assays (E, A549; F, PC9) and by BrdU assays (G, A549; H, PC9; scale bar, 200 μm). (I) Relative expression of miR-7 detected by RT-qPCR in 34 paired LUAD tissues compared with adjacent normal tissues. (J) mRNA expression profiles of A549 cells after knockdown of circFAT1 or transfection with miR-7 mimic; heatmap showing that the genes co-regulated by both the RNAs were largely regulated in the same directions. (K) Relative mRNA expression levels of the reported circFAT1-associated miRNA targets in circFAT1 knockdown A549 cells. Data are presented as mean ± SD; *P < 0.05, **P < 0.01, ***P < 0.001, ns, not significant. ctr, miR-7 mimic control; miR-7, miR-7 mimic; miR-7 Inh, miR-7 inhibitor; Inh ctr, miR-7 inhibitor control.

