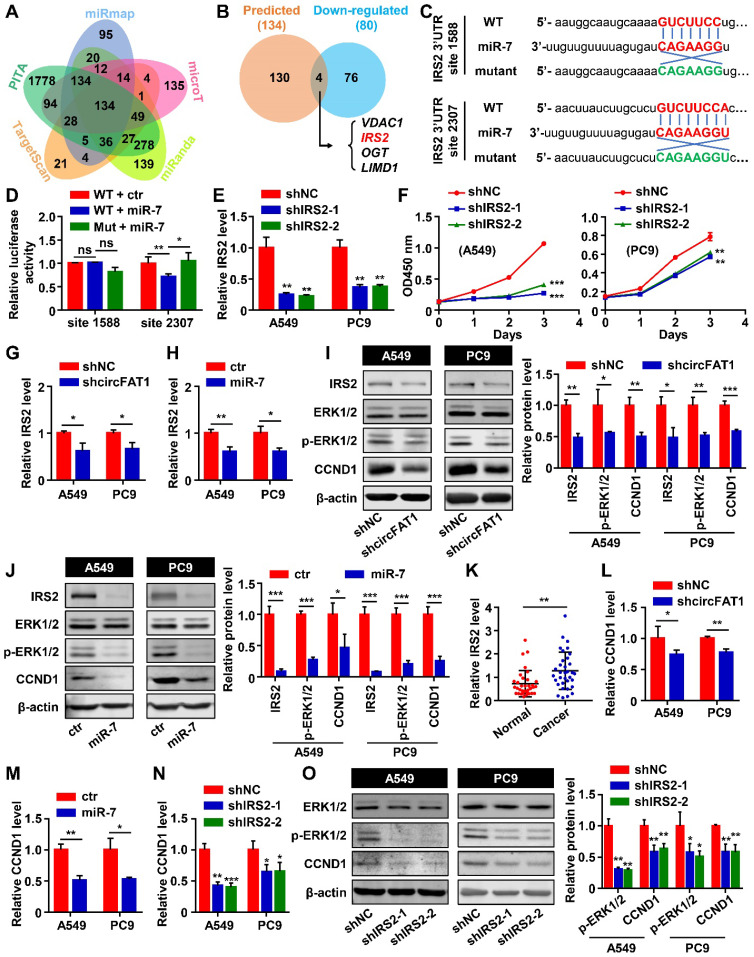
Figure 4.
IRS2 is a direct target of miR-7, and circFAT1 regulates LUAD cells proliferation via miR-7/IRS2/p-ERK1/2/CCND1 pathway. (A) Potential target genes of miR-7 predicted by 5 different algorithms. The numbers of genes predicted by individual tools uniquely or different combinations were indicated. (B) Venn diagram showing the numbers of miR-7 target genes predicted by all five tools and downregulated by both miR-7 mimic and shcircFAT1. (C) Schematic illustration of two predicted miR-7-binding sites (sites 1588 and 2307) in IRS2 3'UTR and the sequences of the sites (3'UTR-WT) and their mutant (3'UTR-Mut) that cloned into luciferase reporter. MiR-7 sequence was included to show matched sequences (Red). The complementary sequences were used in mutants (Green). (D) The relative luciferase activities in 293 T cells after transfected with IRS2 3'UTR-WT or IRS2 3'UTR-Mut reporters and miR-7 mimic or mimic control to show site 2307 was functional. (E) Knockdown efficiencies of shIRS2 tested in A549 and PC9 cells as detected by RT-qPCR. (F) CCK8 assay showing growth curves of A549 and PC9 cells infected with shIRS2 or shNC. (G) Relative IRS2 mRNA expression level in A549 and PC9 cells transduced with shcircFAT1 as detected by RT-qPCR to show downregulation of IRS2 by shcircFAT1. (H) Relative mRNA expression level of IRS2 in A549 and PC9 cells transfected with miR-7 as detected by RT-qPCR, showing downregulation of IRS2 by miR-7. (I and J, Left) Western blot assay showing that shcircFAT1 (I) and miR-7 (J) downregulated IRS2, p-ERK1/2, CCND1, but not ERK1/2 in A549 and PC9 cells. (Right) Quantification of western blot signals. (K) Expression level of IRS2 in 34 paired LUAD clinical samples tested by RT-qPCR. (L-N) RT-qPCR assay showing downregulation of CCND1 mRNA in A549 and PC9 cells by shcircFAT1(L), miR-7 (M) and shIRS2 (N). (O, left) Western blot analysis to show that shIRS2 downregulated p-ERK1/2 and CCND1, but not ERK1/2 protein levels in A549 and PC9 cells. (Right) Quantification of western blot signals. Data are presented as mean ± SD; *P < 0.05, **P < 0.01, ***P < 0.001; ns, not significant; ctr, miR-7 mimic control; Inh, miR-7 inhibitor; Inh ctr, miR-7 inhibitor control.

