Figure 3.
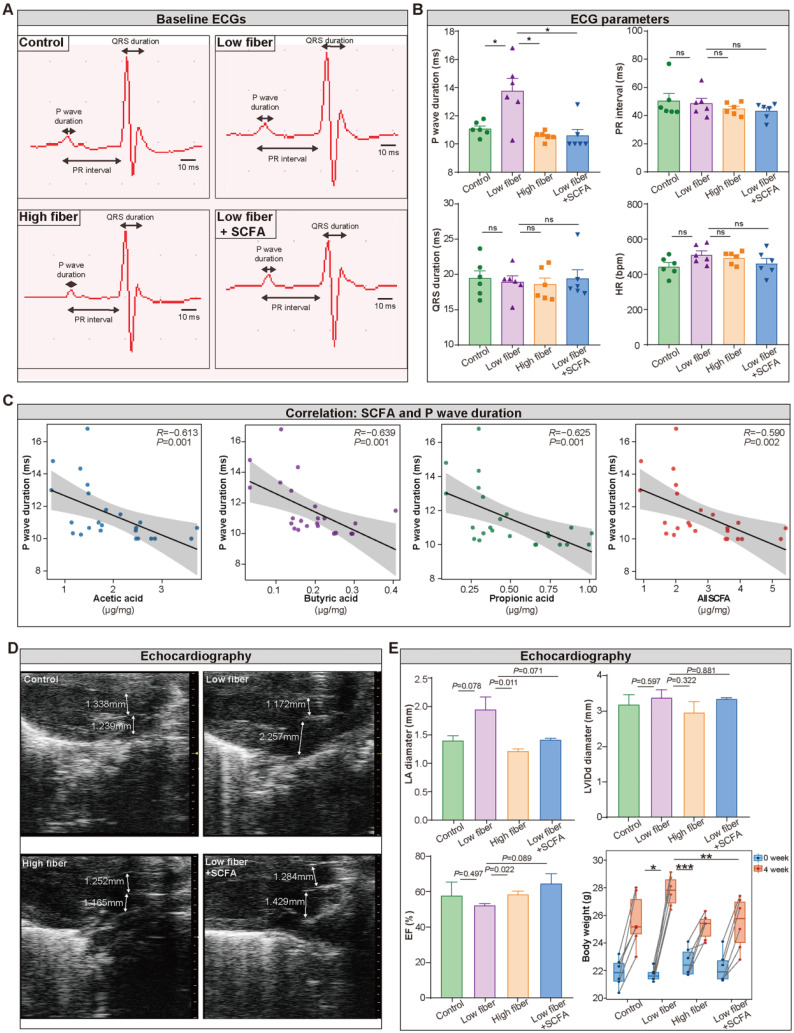
Lack of dietary fiber derived-SCFA alters the physiological index of the left atrium. (A) Representative images of baseline surface ECG in the normal-fiber control, low-fiber, high-fiber, and low fiber+SCFA group. P wave duration, PR interval and QRS duration is indicated by arrows. (B) P wave duration, PR interval, QRS duration, Heart rate (HR) in control (n=6), low-fiber (n=6), high-fiber (n=6) and low fiber+SCFA (n=6) groups. (C) Correlation between SCFA levels and P wave duration. (R=-0.613, P=0.001 for acetic acid; R=-0.639, P=0.001 for butyric acid; R=-0.625, P=0.001 for propionic acid; Spearman correlations). n=6 for each group. (D) Representative images of mice left atrium (LA) and aorta (AO) diameter measured by transthoracic echocardiography. (E) Bar plots of LA diameter, LVIDd diameter, ejection fraction (EF) (n=3 for each group) and alterations of body weight (n=6 for each group) between 0 week and 4 week in control, low-fiber, high-fiber and low fiber+SCFA group. *, P<0.05; **, P<0.01; ***, P<0.001; ns, no significance, data are mean±SEM, student's t-test.

