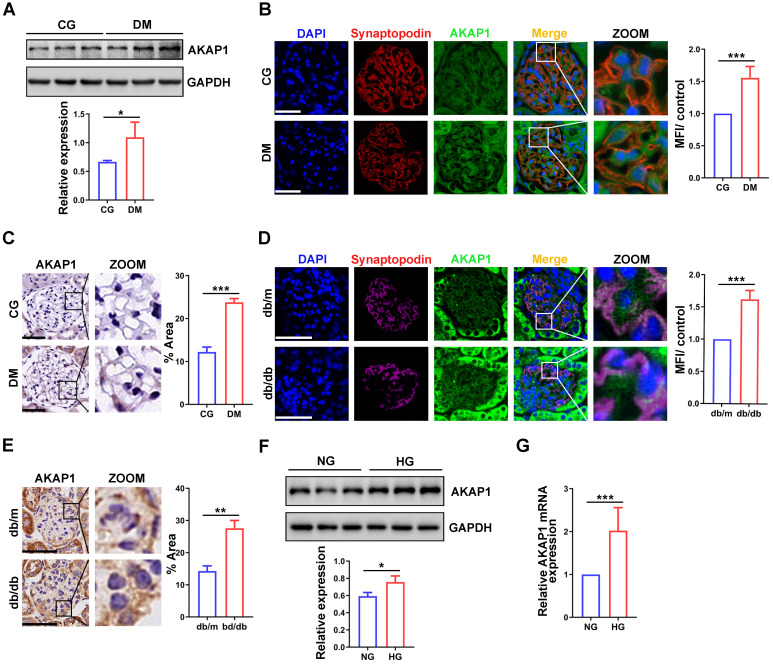
Figure 2.
Changes of AKAP1 expression in podocytes of DKD. (A) Western blot and quantitative analysis of AKAP1 in the renal cortex of STZ-induced diabetic rat group and control group. (n=3, *p < 0.05). (B) IF and quantitative analysis of AKAP1 in glomeruli of the two groups. (Scale bars, 50 µm. n=6, ***p < 0.001). (C) IHC and quantitative analysis of AKAP1 in the glomeruli of the two groups. (Scale bars, 50 µm. n=6, ***p < 0.001). (D) IF and quantitative analysis of AKAP1 in the glomeruli of the diabetic mouse group and control group. (Scale bars, 50 µm. n=6, ***p < 0.001). (E) IHC and quantitative analysis of AKAP1 in the glomeruli of the two groups. (Scale bars, 50 µm. n=6, ***p < 0.001). (F) Western blot and quantitative analysis of AKAP1 in the normal and HG-treated cell groups. (n=3, *p < 0.05). (G) Quantitative PCR analysis of AKAP1 in the two cell groups. (n=6, ***p < 0.001).

