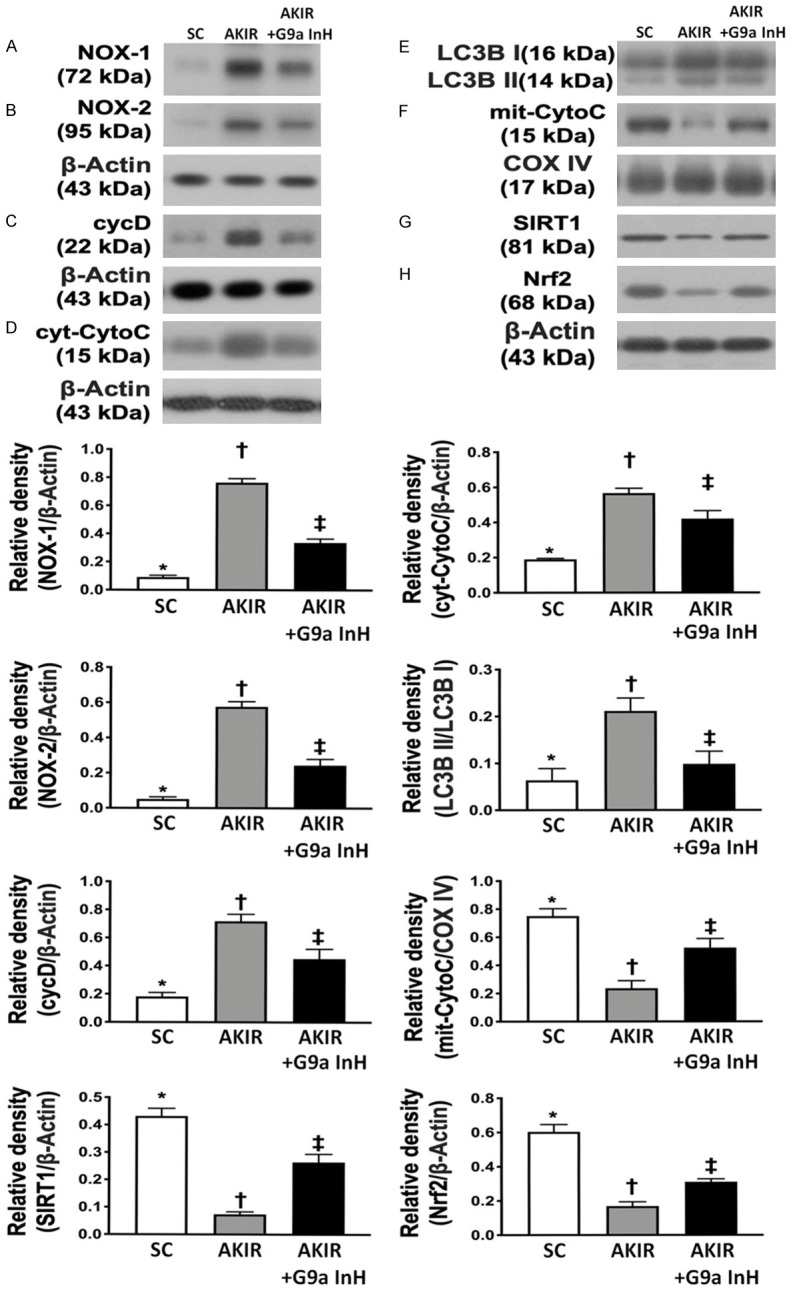
Figure 7.

BIX01294 treatment restrained the oxidative stress, mitochondrial damage and autophagy at 72 h after acute kidney IR injury. A. Protein expression of NOX-1, *P < 0.0001 vs. other groups shown with different symbols (†, ‡). B. Protein expression of NOX-2, *P < 0.0001 vs. other groups shown with different symbols (†, ‡). C. Protein expressions of cyclophilin D (cycD), *P < 0.0001 vs. other groups shown with different symbols (†, ‡). D. Protein expression of cytosolic cytochrome C (cyt-CytoC), *P < 0.0001 vs. other groups shown with different symbols (†, ‡). E. The ratio of the levels of LC3B-II to those of LC3B-I, *P < 0.0001 vs. other groups with different symbols (†, ‡). F. Protein expression of mitochondrial cytochrome C (mit-CytoC), *P < 0.0001 vs. other groups shown with different symbols (†, ‡). G. Protein expression of SIRT1, *P < 0.0001 vs. other groups with different symbols (†, ‡). H. Nuclear factor E2-related factor 2 (Nrf2), *P < 0.0001 vs. other groups with different symbols (†, ‡). All statistical analyses were performed by one-way ANOVA, followed by Bonferroni multiple comparison post hoc test (n = 6 for each group). Symbols (*, †, ‡) indicate significance at 0.05 level. SC = sham-operated control; IR = ischemia reperfusion; G9a InH = inhibition of histone methyltransferase G9a, i.e., BIX01294.
