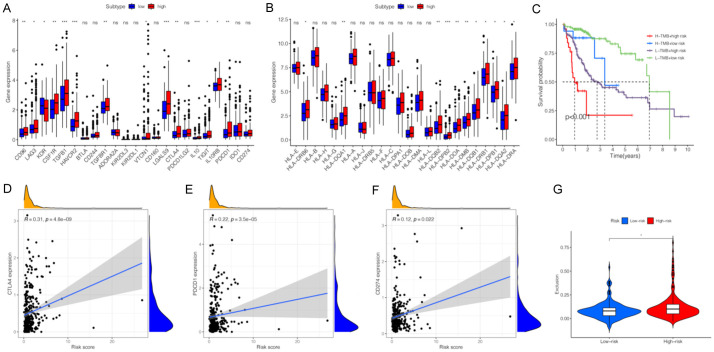
Figure 8.
Comparison of the immunotherapeutic response between high-risk groups and low-risk groups. (A) The expression levels of immune checkpoint blockades (ICBs) between high-risk groups and low-risk groups. (B) The expression levels of human leukocyte antigen (HLA)-related genes between high-risk groups and low-risk groups. (C) Kaplan-Meier survival analysis of TMB value combining with prognostic signature. (D-F) The correlations between CTLA4 (D), PDCD1 (E), CD274 (F) and risk scores. (G) The violin plot of different prediction score of exclusion in two subgroups.

