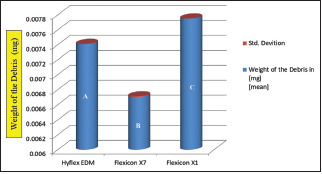
Bar Diagram 1.

Mean wise distribution of the apical extrusion of debris for all the three groups. (Group C Highest and B Least debris extrusion among the groups)

Mean wise distribution of the apical extrusion of debris for all the three groups. (Group C Highest and B Least debris extrusion among the groups)