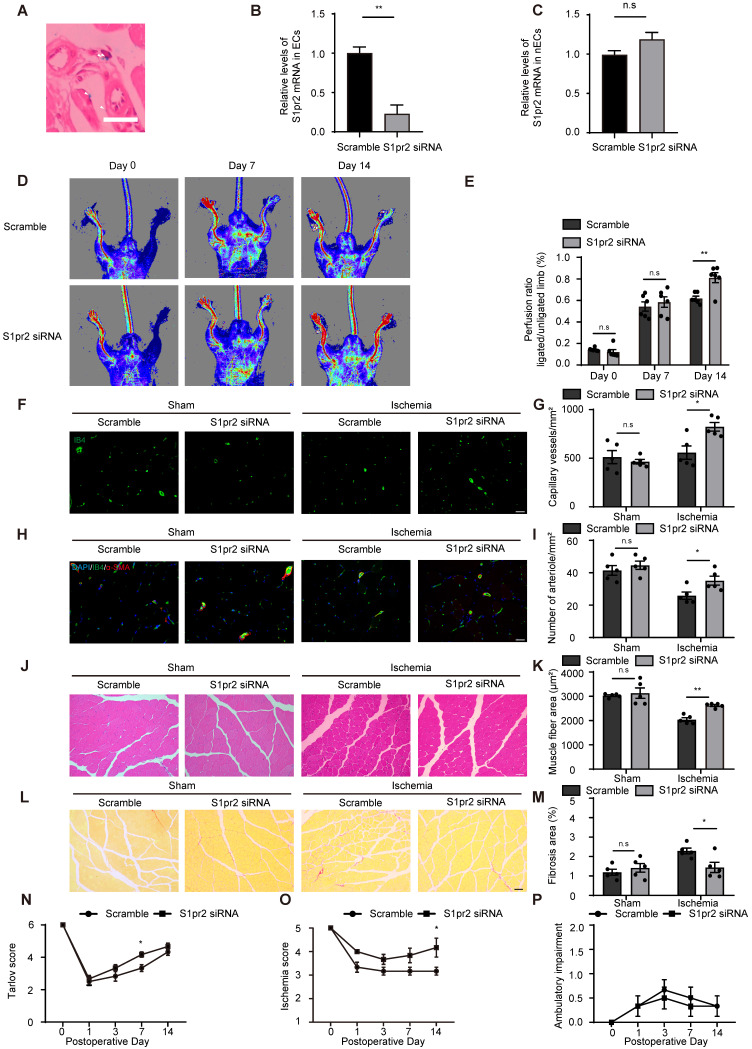
Figure 7.
RGD-peptide magnetic nanoparticle EC target delivery of S1pr2-siRNA enhances post-ischemic angiogenesis and blood flow perfusion in the hindlimb. A, Perlus staining shown that RGD-Fe3O4 magnetic nanoparticles (arrowhead) are successfully delivered to hindlimb ECs (n = 3). B-C, RGD-nanoparticle packaging S1pr2-siRNA target delivery reduces the expression of S1pr2 (B), as shown by RT-qPCR in hindlimb ECs, with no significant change of S1pr2 expression in the remaining hindlimb components when ECs were removed (C) (n = 3). D, Representative laser Doppler images show improved blood flow perfusion in mice treated with S1pr2-siRNA compared with those treated with scramble-siRNA. E, Cumulative results for mice treated with S1pr2-siRNA (n = 6) or scramble-siRNA (n = 6) are shown graphically as the ratio of blood flow in ischemic limb to that in the non-ischemic limb at each time point. F-G, Representative images of isolectin-B4 staining of gastrocnemius muscles in mice treated with S1pr2-siRNA or scramble-siRNA (F), with quantification of capillary density in gastrocnemius muscles after sham or HLI operation (G) (n = 5). H-I, Representative images of α-SMA staining of gastrocnemius muscles in mice treated with S1pr2-siRNA or scramble-siRNA (H), with quantification of arteriole density in gastrocnemius muscles after sham or HLI operation (I) (n = 5). J-K, Representative images of H&E staining of gastrocnemius muscles in mice treated with S1pr2-siRNA or scramble-siRNA (J), with quantification of muscle fiber area after sham or HLI operation (K) (n = 5). L-M, Representative images of Sirius red-stained of gastrocnemius muscles in mice treated with S1pr2-siRNA or scramble-siRNA (L), with quantification of the percentage of fibrotic tissue in muscle (M) (n = 5). N-P, Functional assessment of ischemic muscle over follow-up. Cumulative results for mice treated with S1pr2-siRNA or scramble-siRNA are shown graphically as Tarlov score (N), ischemia score (O), and ambulatory impairment score (P) (n = 6). Scale Bars: F and H, 50 μm; J and L,100 μm. Data are mean ± SEM. n.s indicates not significant. *P < 0.05; **P < 0.01.

