Figure 4.
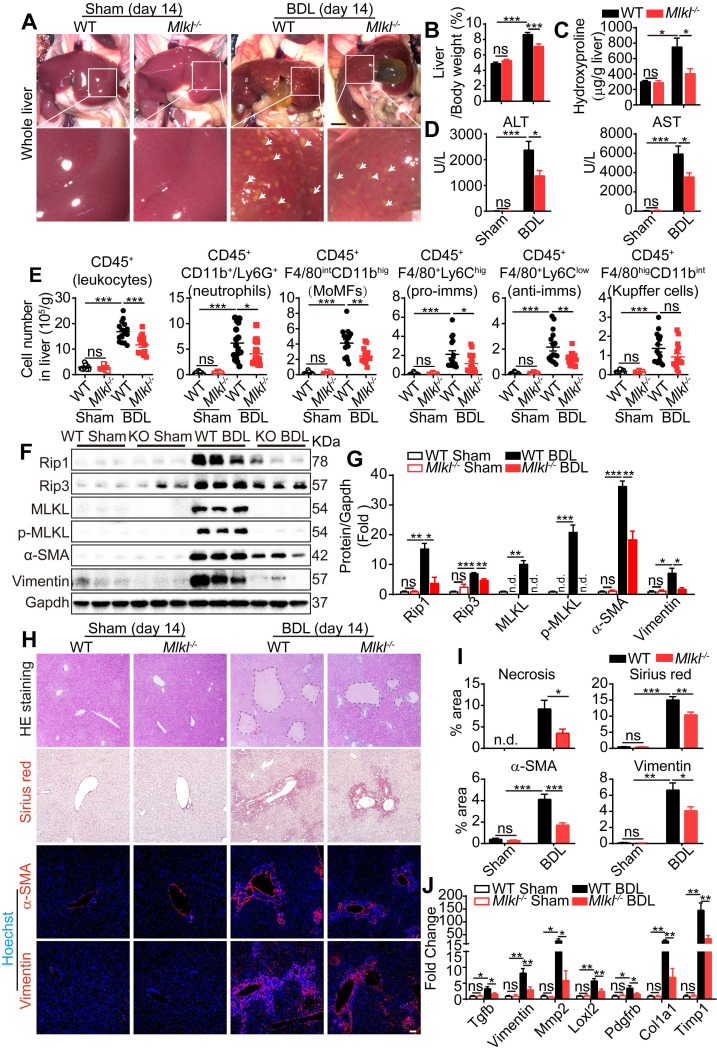
Knockout of Mlkl attenuates BDL-induced liver injury. (A) Representative pictures of whole liver from WT or Mlkl-/- mice, 14 days after BDL, sham-operated mice were used as control. Bile infarcts (arrows) on the liver surface were indicated. Scale bar represents 0.5 cm. (B) Quantification of the liver/body weight ratio in (A) (Sham groups, n=10; BDL groups, n=16). (C) Hydroxyproline levels in the livers of sham or BDL mice (day 14) (Sham groups, n=10; BDL groups, n=16). (D) The amounts of ALT and AST in the serum of sham or BDL mice (day 14) (sham groups, n=10; BDL groups, n=16). (E) Quantification of the numbers of total leukocytes, neutrophils, MoMFs, pro-imms, anti-imms, and Kupffer cells, in the livers of sham or BDL mice (day 14) (sham groups, n=10; BDL groups, n=16). (F) Western blot analyses of Rip1, Rip3, MLKL, p-MLKL, α-SMA, and Vimentin in sham and BDL mice liver samples (each lane represents one animal). (G) Quantification of the blots in (F). All proteins were normalized to Gapdh in the same sample, then normalized to WT-sham mice. (H) Representative images of H&E staining, Sirius red staining, and immunofluorescence staining of α-SMA and Vimentin on Paraffin-embedded liver sections. Nuclei were stained with Hoechst 33342. (I) Quantification of positive staining areas in (H) (sham groups, n=3; WT-BDL, n=6, Mlkl-/--BDL, n=7). (J) Quantitative RT-PCR analysis of hepatic fibrosis genes Tgfb, Vimentin, Mmp2, Loxl2, Pdgfrb, Col1a1, and Timp1 in liver samples (sham groups, n=3; WT-BDL, n=6, Mlkl-/--BDL, n=7). Data are shown as Means ± SEM, *P < 0.05, **P< 0.01, ***P< 0.001 (Student's t-test). Scale bar represents 100 µm.

