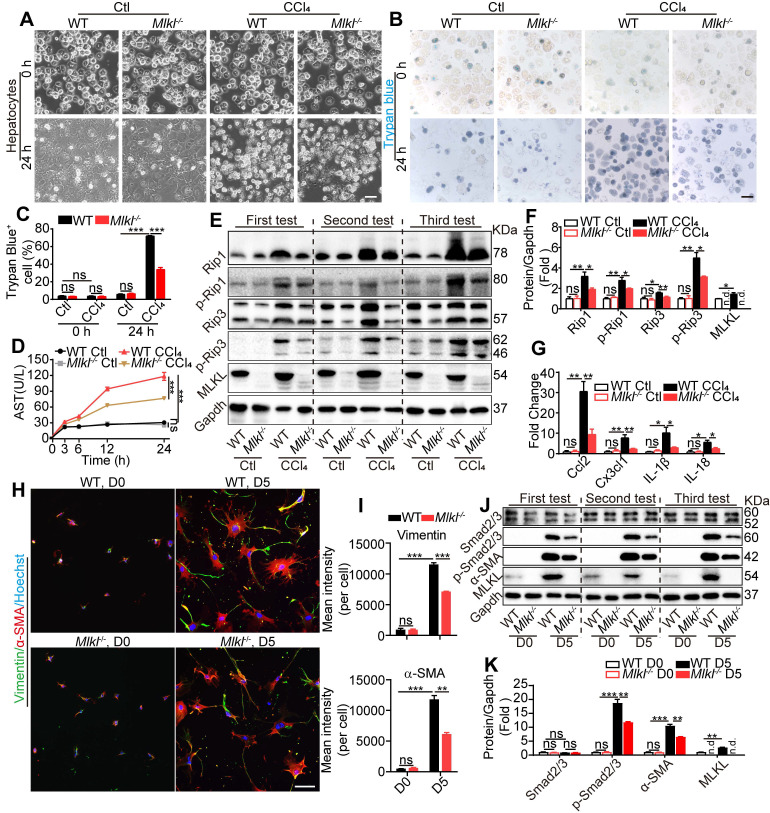
Figure 5.
Mlkl deletion reduces hepatocyte necroptosis and HSC activation in vitro. (A) Representative morphology of WT and Mlkl-/- hepatocytes treated with CCl4 or vehicle for 24 h. (B, C) Representative images (B) and statistics (C) of trypan blue staining in WT and Mlkl-/- hepatocytes treated with CCl4 or vehicle for 24 h (n=3). (D) AST in the culture medium of WT and Mlkl-/- hepatocytes treated with CCl4 or vehicle at the indicated time points (n=3). ***P< 0.001 (two-way ANOVA). (E) Western blot analyses of Rip1, p-Rip1, Rip3, p-Rip3, and MLKL in WT and Mlkl-/- hepatocytes treated with CCl4 or vehicle for 24 h. Three independent experiments were shown. (F) Quantification of the blots in (E). All protein levels were first normalized to Gapdh in the same sample and then normalized to WT cells treated with vehicle. (G) qRT-PCR analysis of the mRNA level of Ccl2, Cx3cl1, IL-1β and IL-18 in hepatocytes treated with CCl4 or vehicle for 24 h. (H) Immunofluorescence staining of α-SMA and Vimentin in HSCs freshly isolated from mice (D0) or cultured for 5 days (D5). (I) Quantification of mean fluorescence intensity in (H) (3 animals for each group, six random fields for each animal). (J) Western blot analyses of Smad2/3, p-Smad2/3, α-SMA, and MLKL in WT-HSCs and Mlkl-/--HSCs at D0 and D5. Three independent experiments were shown. (K) Quantification of the blots in (J). All protein levels were first normalized to Gapdh in the same sample and then normalized to WT cells in D0. Data are shown as Means ± SEM, *P < 0.05, **P< 0.01, ***P< 0.001 (Student's t-test for C, F, G, I and K) . Scale bar represents 100 µm.

