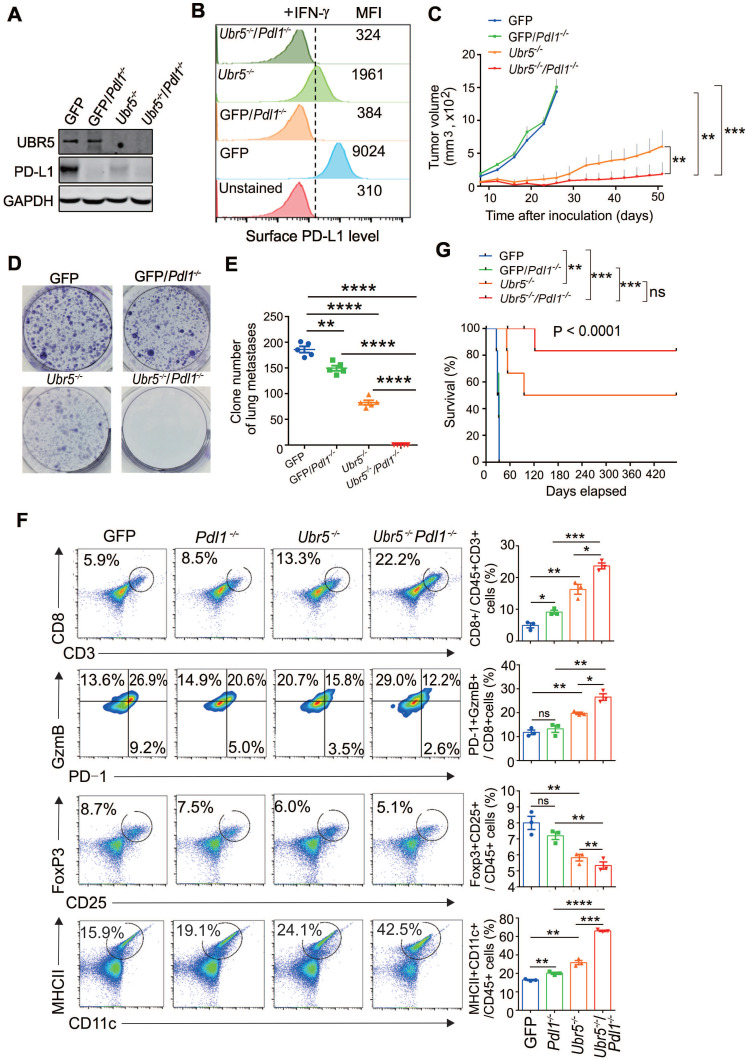
Figure 3.
Combined genetic targeting of Ubr5 and Pdl1 yields synergistic therapeutic effects. (A-B) 4T1/GFP/Pdl1-/- and 4T1/Ubr5-/-Pdl1-/- cells were generated by CRISPR/Cas9 editing. WT, Ubr5-/-, GFP/Pdl1-/- or Ubr5-/-Pdl1-/- 4T1 cells were treated with 10 ng/mL IFN-γ for 24 h, and then the UBR5 and PD-L1 protein levels were detected by western blot (A) and surface PD-L1 levels were measured by flow cytometry analysis (B). (C) A total of 1×10⁶ WT, Ubr5-/-, GFP/Pdl1-/- or Ubr5-/-Pdl1-/- 4T1 cells were subcutaneously injected into the mammary pads to monitor tumor growth in WT (BALB/c) mice (n=6 mice per group). Tumor size was measured every 3 days. (D-G) WT, Ubr5-/-, GFP/Pdl1-/- or Ubr5-/-Pdl1-/- 4T1 cells (5×10⁵) were injected via the tail vein into 7-week-old female BALB/c mice (n=5 mice per group). Twelve days later, the mice were sacrificed, and single-cell suspensions were obtained from lung tissue to perform clonogenic assays in order to evaluate lung metastasis. Images of 6-well plates in a representative experiment are shown in (D), and colonies were quantified (E). (F) On Day 10 after tumor cells inoculation, CD8+ T cells infiltration and GzmB+/PD-1-/CD8+ T cells in tumor tissue from mice bearing 4T1 WT, Ubr5-/-, hUBR5-or mPdl1-reconstituted Ubr5-/- tumor were analyzed by flow cytometry. Flow cytometry analyzed CD25+, Foxp3+ Tregs and CD11c+, MHC Ⅱ+ DCs in tumor-draining lymph nodes. n=3 mice per group. The survival curve is shown in (G). The results are presented as the mean ± SEM. ns, no significance, *P < 0.05, **P < 0.01, ***P < 0.001, ****P < 0.0001.

