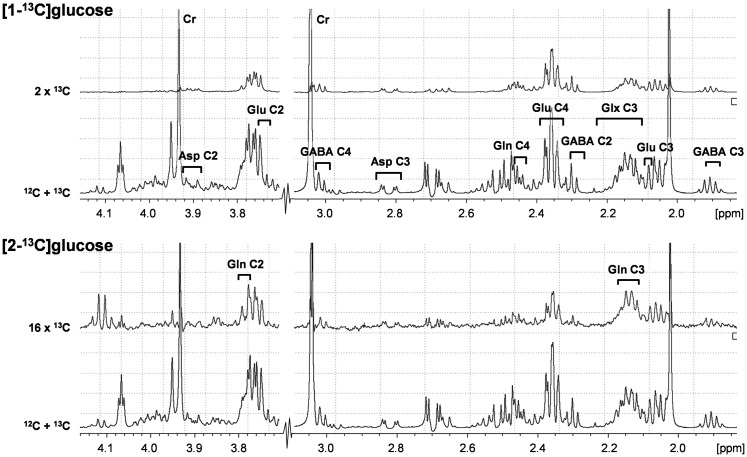
Figure 1.
Representative 1H-[13C]NMR spectra from rat cerebral cortex obtained ex vivo following infusion with [1-13C]glucose (upper two traces) or [2-13C]glucose (lower two traces). 12C+13C indicates total spectra, and difference spectra have been multiplied to emphasize peaks, hence denoted 2x13C and 16x13C. Numbers indicate carbon position in glutamate (Glu), glutamine (Gln), glutamate+glutamine (Glx), γ-aminobutyric acid (GABA), and aspartate (Asp).

