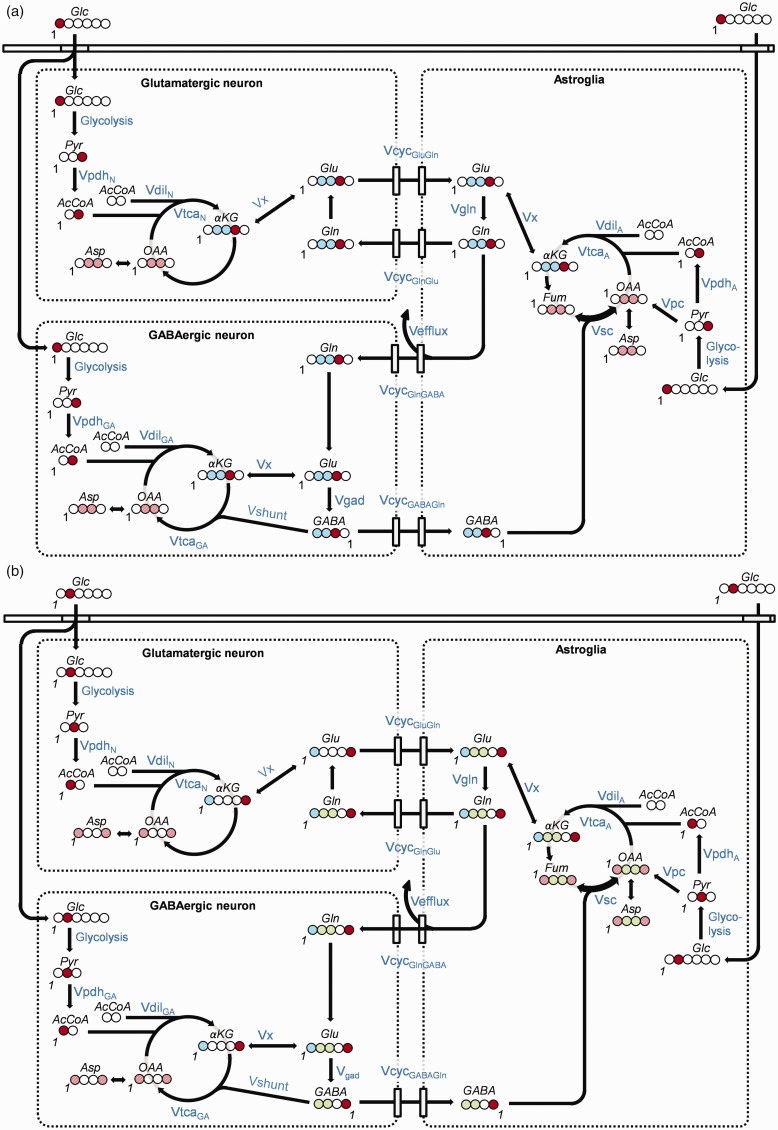
Figure 2.
Schematic diagram of the labeling of cerebral metabolites from (a) [1-13C]glucose and (b) [2-13C]glucose, respectively. Circles represent carbon atoms. Whole filled circles: 100% 13C-enrichment at this carbon-position of the molecule; Same colorContinued.diagonally striped circles: 13C-labeling is split between these positions; Red: Labeled position after first turn of the TCA cycle; Blue: Labeled position of the second turn of the TCA cycle; Green: Label position after entry of pyruvate carbons into the TCA cycle via pyruvate carboxylase (PC). The number ‘1’ denotes the position of carbon number one in each molecule. All metabolic pathways are named in blue letters and illustrated by black arrows. Abbreviations: Glc: glucose; Pyr: pyruvate; AcCoA: Acetyl-Coenzyme A; αKG: α-ketoglutarate; OAA: oxaloacetate; Fum: fumarate; Asp: aspartate; Glu: glutamate; Gln: glutamine; GABA: gamma-aminobutyric acid; Vpdh: rate of pyruvate dehydrogenase; Vdil: rate of dilution; Vtca: rate of tricarboxylic acid cycle; Vefflux: rate of loss of carbon from the astrocytic TCA cycle via efflux of Gln from the brain, partly balanced by entry of glutamine from the blood at the rate VdilGln (not shown); VcycGluGln: rate of Glu/Gln-cycle; VcycGABAGln: rate of GABA/Gln-cycle; Vpc: rate of pyruvate carboxylase; Vgad: rate of glutamate decarboxylase, GABA synthesis, Vgln: rate of glutamine synthesis; Vshunt: rate of the GABA shunt, i.e. GABA degradation in the GABAergic neuron; Vx: rate of aminotransferase. Designations ‘GA’, ‘A’ and ‘N’ after a pathway rate indicates rate in the GABAergic neuronal, astroglial and glutamatergic neuronal compartments, respectively.

