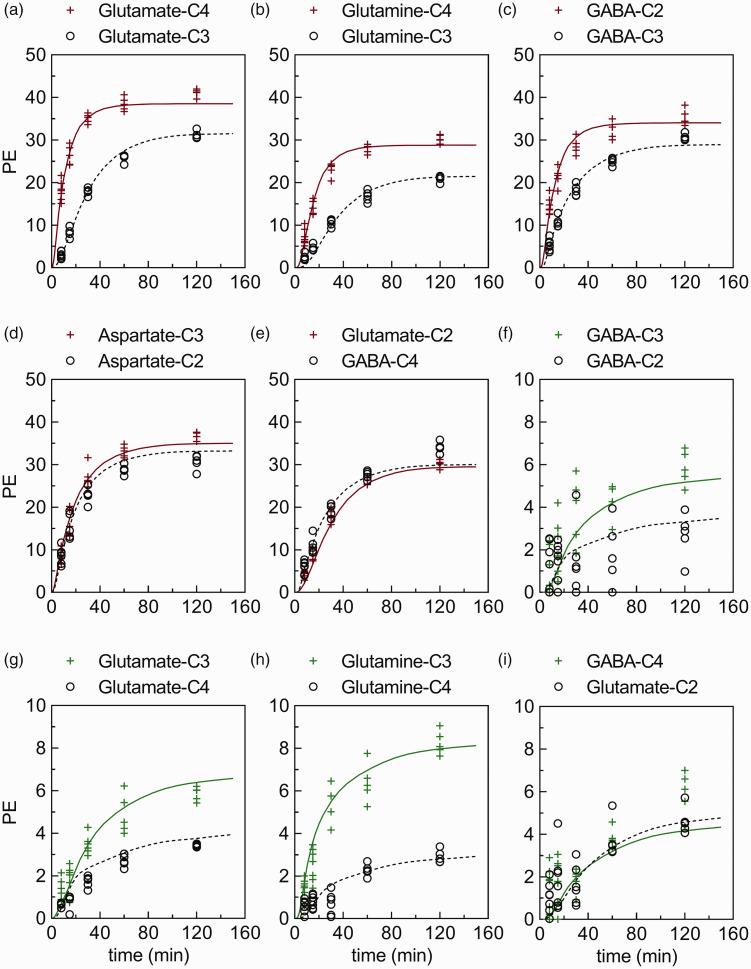
Figure 3.
Best fits of the metabolic model (full red/green or dotted black lines) to experimental time course data from cerebral cortex (red/green plus and black circle symbols, respectively). The time courses for percentage 13C-enrichment (PE) of (a–e) glutamate-C4,C3,C2, glutamine-C4,C3, GABA-C2,C3,C4, and aspartate-C2,C3 from [1-13C]glucose or (f–i) glutamate-C4,C3,C2, glutamine-C4,C3, and GABA-C2,C3,C4 from [2-13C]glucose infused rats obtained with 1H-[13C]NMR. The time courses representing the cerebellum, hippocampus and striatum can be found in supplementary information Figure S2, Figure S3 and Figure S4, respectively. The majority (84 of 90) of time course data sets from cerebral cortex (n = 5–7 for each time point) passed the Shapiro-Wilk test for normality.

