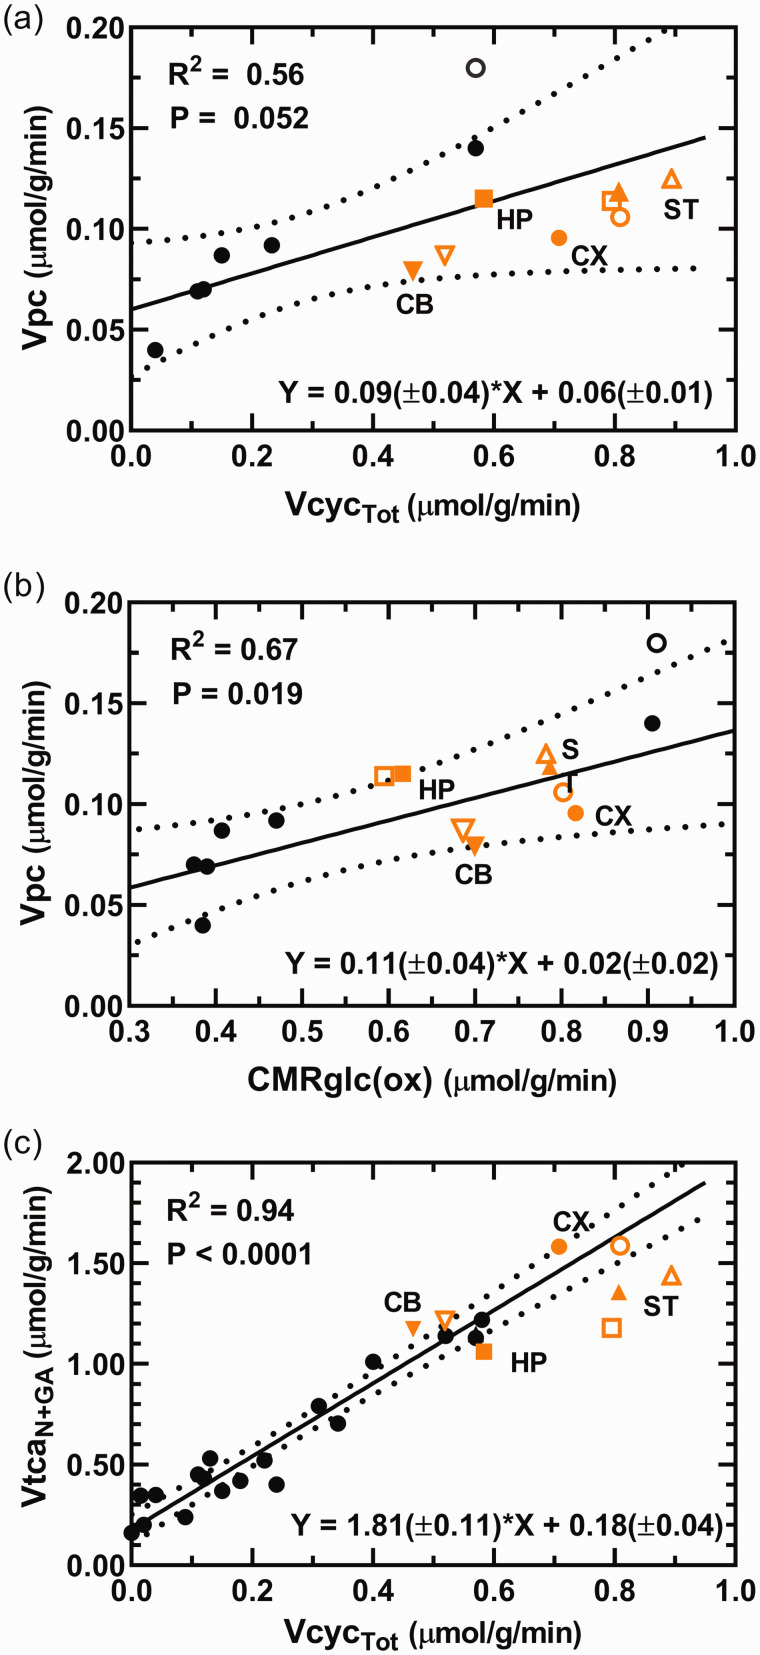
Figure 5.
(a, b) Relationship between the rates of pyruvate carboxylation (Vpc) and total glutamate/GABA-glutamine cycling (VcycTot) and total glucose oxidation in neurons and astroglia (CMRglc(ox)). The regression analyses include cerebral cortex data from the current study (CX; orange filled circle) and literature values from studies of whole brain or cerebral cortex (black circles;19,20,30,50,51,84,85) of rats under awake and anesthetized conditions and where astroglial OAA-to-fumarate recycling was not allowed in the model, i.e., Vsc = 0 in the current study. Values for cerebellum (CB; inverted triangles), hippocampus (HP; squares) and striatum (ST; triangles) were superimposed on graphs for comparison but were not included in the regression analyses and parameters shown on the respective graphs. The unfilled symbols represent best-fit solutions allowing astroglial OAA-to-fumarate cycling for the corresponding brain region, which included the study by Öz et al (2004). 30 All brain regions fell within the 95% confidence interval of the best fit line. In a, including all brain regions in the least-squares best fit to the data yielded a line with slope of 0.08(±0.02) and y-intercept of 0.06(±0.01), R2 = 0.60 and P = 0.009 (slope significantly different from zero). In b, including all brain regions in the least-squares best fit to the data yielded a line with slope of 0.11(±0.03) and y-intercept of 0.03(±0.02), R2 = 0.60 andContinued.P = 0.008 (slope significantly different from zero). (c) Relationship between the total TCA cycling in neurons (VtcaN+GA = VtcaN + VtcaGA) and total glutamate and GABA neurotransmitter cycling (VcycTot = VcycGluGln + VcycGABAGln). The regression analysis includes CX data from the current study (orange circle) and literature values from studies of anesthetized and awake rats (black circles; e.g. awake or using α-chloralose, morphine, halothane, different doses of pentobarbital, or urethane;19,20,25,26,30,49,50,84–87). Values for CB, HP and ST data from the current study are superimposed for comparison but were not included for the regression analysis and the parameters shown on the respective graphs. In c, including all brain regions in the least-squares best fit to the data yielded a line with slope of 1.68(±0.10) and y-intercept of 0.20(±0.04), R2 = 0.93 and P < 0.0001 (slope significantly different from zero). (a–c) All literature values included in the analyses derive from studies performed on rats using 13C-labeled substrates and in vivo or ex vivo NMR. On all graphs a trend line and 95% confidence intervals are shown along with the parameters from the regression analysis: R2, Pearson product-moment correlation coefficient; P value, significance of the difference in the value of the slope from zero; equation with slope and y-intercept, ± SE.

