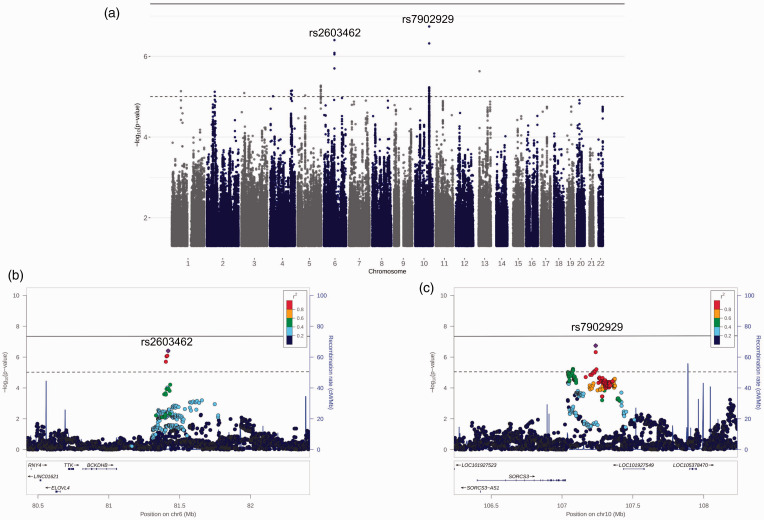
Figure 2.
Stage 2 mega-analysis results. (a) Manhattan plot of Stage 2 GWAS mega-analysis of NACC and ROSMAP. The horizontal dashed line in each plot is the suggestive threshold (p < ) while the solid line is the threshold for genome-wide significance (p < ). (b & c) Regional plots of rs2603462 and rs7902929 +/− 1000 kb, respectively.

