Figure 5.
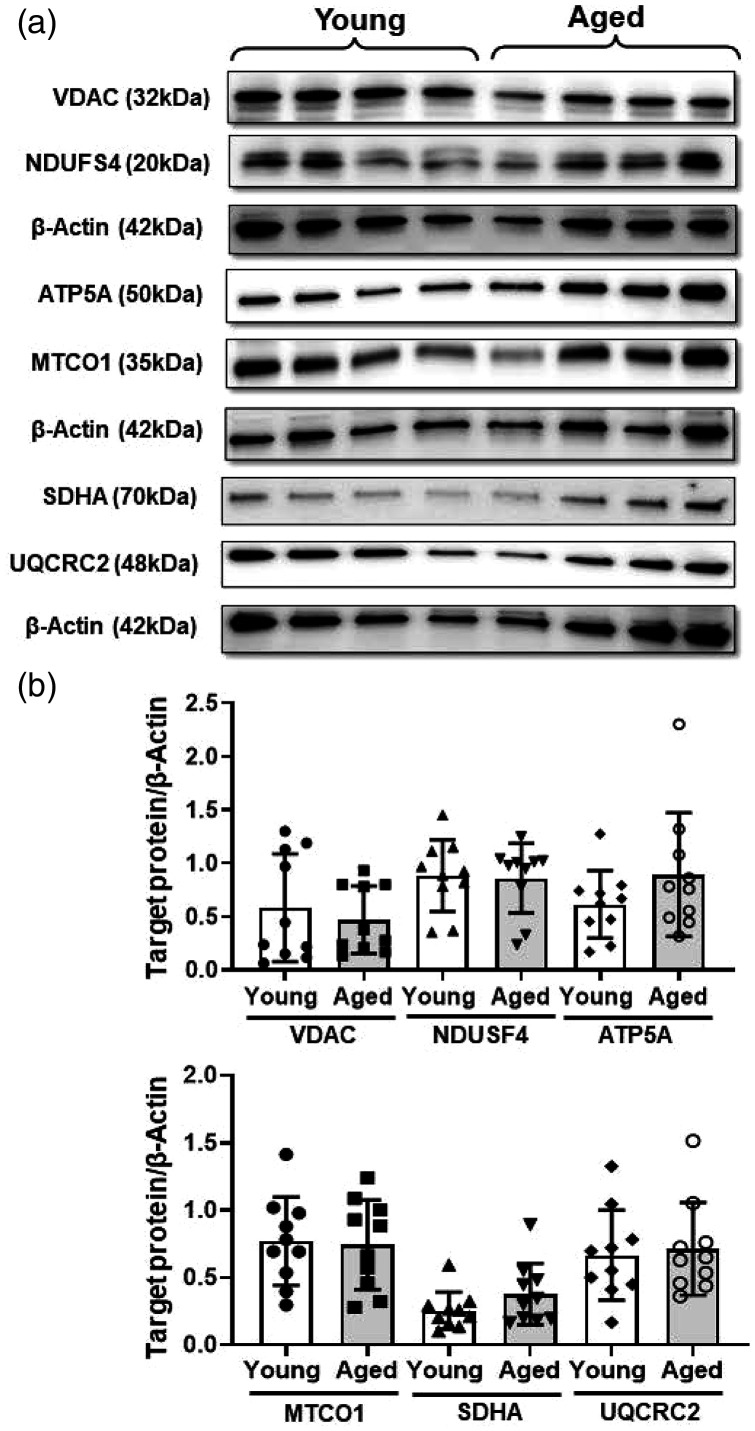
Western blot analysis revealed unaltered mitochondrial voltage-dependent anion channel (VDAC) and electron transport chain (ETC) complex proteins. (a) Representative western blot images of VDAC, complex 1 ((NADH:ubiquinone oxidoreductase subunit S4, NDUSF4, Santa Cruz, sc-100567), complex V (ATP Synthase F1 Subunit Alpha, ATP5A), complex IV (mitochondrially encoded cytochrome c oxidase I, MT-CO1), complex II (Succinate Dehydrogenase Complex Flavoprotein Subunit A, SDHA), complex III (ubiquinol-cytochrome c reductase complex core protein 2, UQCRC2), and β-actin as internal control. (b). Cumulative data of the immunoband intensity are represented as bar graphs of respective protein to β-actin band density ratios. Data were represented as mean ± SD and analyzed by student’s t-test. P ≤ 0.05 was taken as the statistical significance. N = 10 mice/age group. All the original immunoblots are included in the online supplementary Figures 6 to 14.

