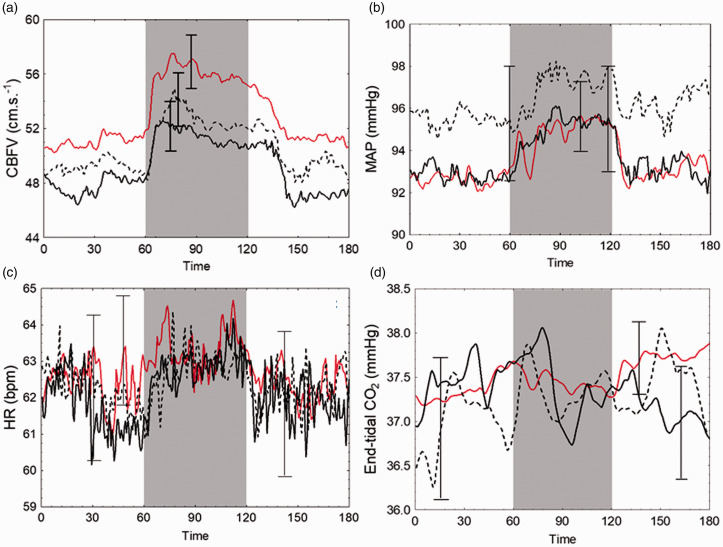
Figure 3.
Average data for physiological parameters in response to neural stimulation for healthy controls and PD subgroups. Shaded area represents period of stimulation. Solid red line, healthy controls; solid black line, PD medicated; black dotted line, PD unmedicated. Error bars are largest ± standard error at the point of occurrence. (a) CBFV, averaged cerebral blood flow velocity across both hemispheres. (b) MAP, mean arterial pressure. (c) HR, heart rate. (d) end-tidal CO2.

